David M. Lentz
In Part 2 of this series, we showed you how to use CloudWatch to monitor metrics and logs from Amazon MQ. With CloudWatch, you can easily create ad-hoc graphs to visualize the performance of your messaging infrastructure and other AWS services you use (such as EC2, Lambda, and S3). But to monitor your Amazon MQ brokers, destinations, and clients alongside the rest of your applications and infrastructure, you need a monitoring platform that easily integrates with your whole technology stack. In this post, we’ll show you how to use Datadog to:
- Collect Amazon MQ metrics
- Visualize metrics with pre-built and custom dashboards
- Analyze Amazon MQ logs
- Create alerts based on your metrics and logs
Collecting Amazon MQ performance data
Datadog’s AWS integration makes it easy to visualize and alert on your Amazon MQ metrics and logs. In the next section, we’ll give an overview of how to integrate your AWS account with Datadog to begin collecting metrics and logs from your Amazon MQ infrastructure. If you’re already using Datadog to collect metrics from any of your AWS services, you should skip ahead to the following section.
Integrate your AWS account with Datadog
If this is the first time you’re using Datadog to collect AWS data, you’ll need to create a new IAM role in your AWS account and identify Datadog’s AWS account as the trusted entity. Then you’ll need to attach a policy to this role that grants read-only access to Amazon MQ (and any other AWS services you want to monitor) so Datadog can collect your AWS metrics. See the instructions in our documentation for detailed guidance on setting up the AWS integration.
Enable collection of Amazon MQ metrics
Once you’ve created the Datadog integration role in AWS, you need to configure it to collect metrics from Amazon MQ, as well as any other AWS services you want to begin monitoring. In your Datadog account, navigate to the AWS integration tile and click the Configuration tab. Make sure that the MQ box is checked under the Limit metric collection by AWS Service list. If you haven’t done so already, you’ll need to add your account ID and the name of the role you created earlier under the AWS Accounts section. Then, click the Install Integration button (or the Update Configuration button if you’ve already configured other AWS integrations).
If you want to collect and analyze Amazon MQ logs in Datadog, you’ll also need to set up the logs integration. We’ll show you how to do that later on in this post.
Tag your metrics
Adding tags to your metrics gives you depth and flexibility in how you visualize them, and helps you understand the information they convey. Datadog automatically creates tags from the CloudWatch dimensions associated with your Amazon MQ metrics, so you can filter and aggregate your metrics based on tags like region, broker, queue, and topic.
You can easily add custom tags to a new or existing broker, whether you’re using the Amazon MQ console or CloudFormation. The code snippet below shows a portion of a CloudFormation template that creates a broker with two custom tags applied to it:
TestBroker1: Type: "AWS::AmazonMQ::Broker" Properties: Tags: - Key: "env" Value: "development" - Key: "app" Value: "enrollment"Datadog will automatically pull these custom key-value tags and apply them to any metrics collected from this broker, so you can use them to slice and dice your data. For example, an env tag like the one shown above can help you easily distinguish metrics from your development stack from that of your production infrastructure.
Visualizing Amazon MQ performance
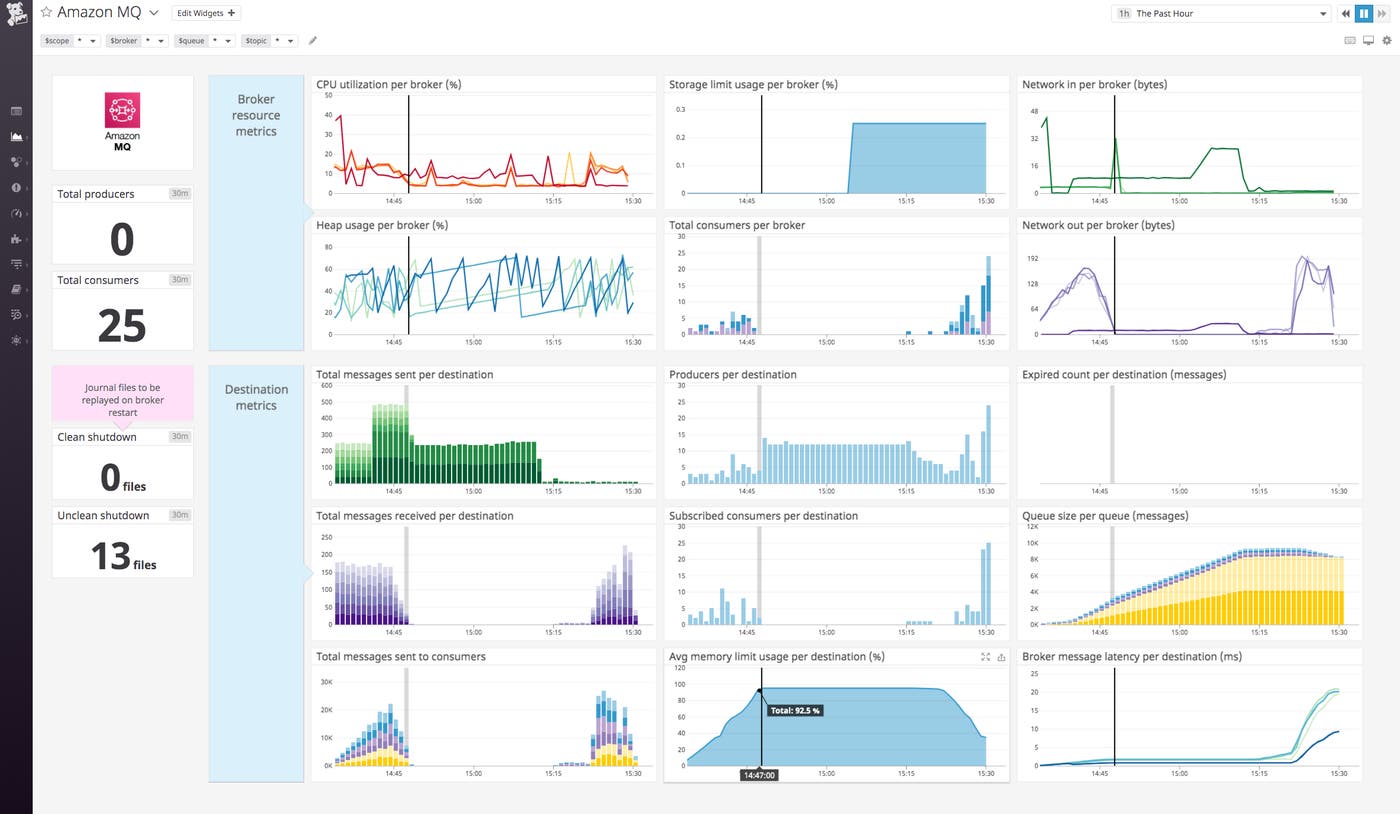
Once your AWS integration is enabled, you can use the out-of-the-box dashboard to visualize Amazon MQ metrics. Each graph on the dashboard provides information about important broker and destination metrics we looked at in Part 1 of this series, and gives you a starting point to investigate potential problems.
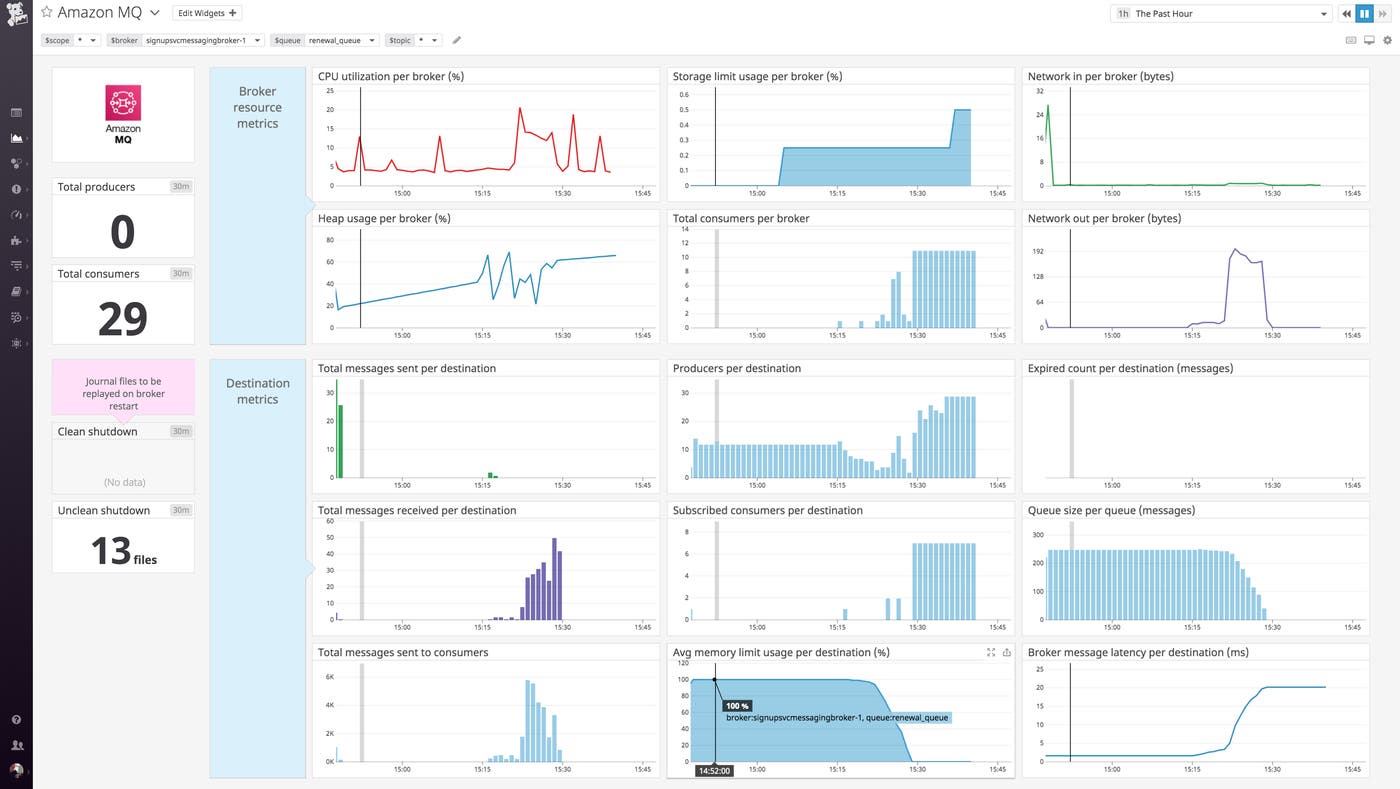
This dashboard includes template variables, which you can use to filter the graphs based on your tags. In the screenshot below, we’ve used template variables to show only data from the queue named renewal_queue and the broker named signupsvcmessagingbroker. (Amazon MQ appends -1 to the name of any standalone broker, and -1 and -2 to brokers deployed in redundant pairs for high availability.)
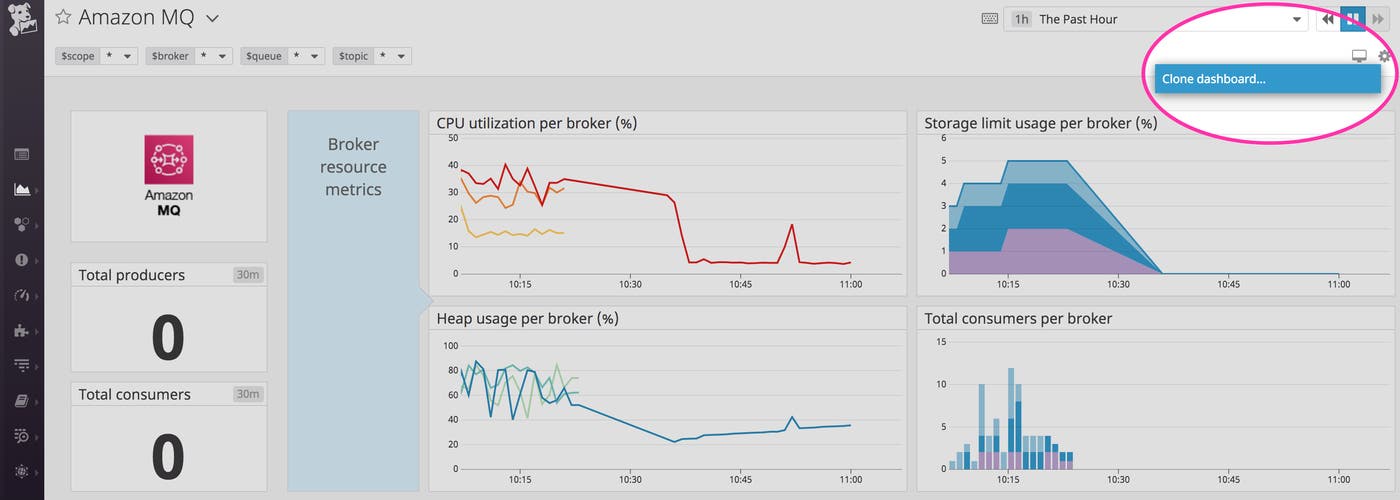
As you determine what metrics are most useful to you, you can hone your monitoring by creating your own dashboards. To quickly start customizing this out-of-the-box dashboard, you can click the gear in the upper right and select Clone dashboard.
Your dashboards aren’t limited to Amazon MQ metrics. You can customize your dashboards to correlate Amazon MQ metrics with data from any of Datadog’s 1,000+ integrations, allowing you to get a unified view of your entire messaging infrastructure in a single pane of glass.
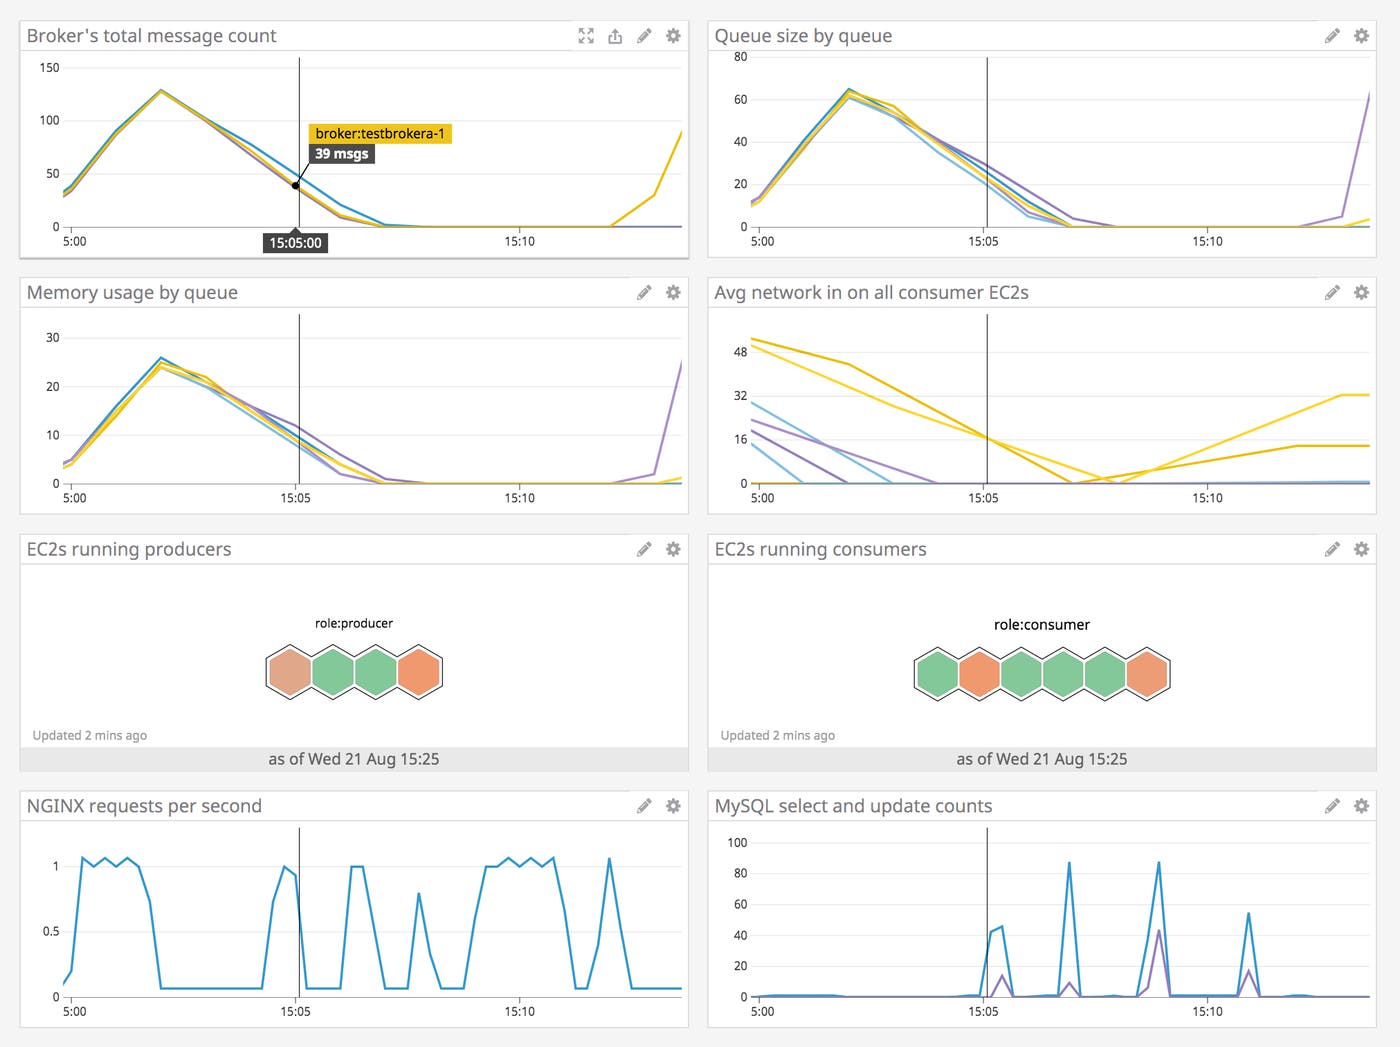
You can easily add graphs to your dashboard to track the performance of AWS services as well as any other technologies you’re monitoring with Datadog. The custom dashboard below shows data from an example application that comprises a public-facing website backed by distributed services that communicate using Amazon MQ. The graphs show broker and destination metrics, host maps displaying the CPU usage of the clients connected to the broker, and throughput information from the website’s NGINX web server and MySQL database.
Collecting and analyzing Amazon MQ logs
When the graphs on your dashboard indicate a possible issue with Amazon MQ performance, you can navigate to related logs to investigate the issue. In this section, we’ll show you how to collect your Amazon MQ logs in Datadog so you can analyze, graph, search, and alert on them.
Log collection is disabled in Amazon MQ by default. You can enable it on a new or existing broker by configuring it to send general logs and/or audit logs to CloudWatch, as described in Part 2 of this series. Our examples in this section will focus on general logs, since they provide information about the activity of the broker (whereas audit logs record configuration changes made to your broker). See the Amazon MQ documentation for more details about these two types of logs.
Deploy the Datadog log forwarder
To forward logs from CloudWatch Logs to Datadog, you’ll need to deploy the Datadog-Log-Forwarder Lambda function. You should configure the trigger to execute the function automatically when Amazon MQ logs are collected by CloudWatch, forwarding them to Datadog so you can view, search, and alert on them. See the Datadog AWS integration documentation for instructions on how to deploy this function from the AWS Serverless Repository.
You can tag your Amazon MQ logs to differentiate them from logs emitted by other AWS services, or to aggregate related logs that come from different sources. For example, you could apply the same tag to your Amazon MQ logs and to EC2 logs from the instances that host your producers and consumers. You can use this tag to aggregate these logs into a single view to better understand the performance of your entire messaging infrastructure.
To apply custom tags to your Amazon MQ logs, navigate to the Lambda console and click the name of the function that was created when you deployed the Datadog-Log-Forwarder. Scroll down to the Environment variables section of the page and create a new environment variable with the key DD_TAGS, then add a comma-delimited list of tags in key-value format, such as app:enrollment,env:development, as shown below. Note that, in this example, we are using the same tags we added to the broker’s metrics via CloudFormation in an earlier section of this post.

Search and filter your logs
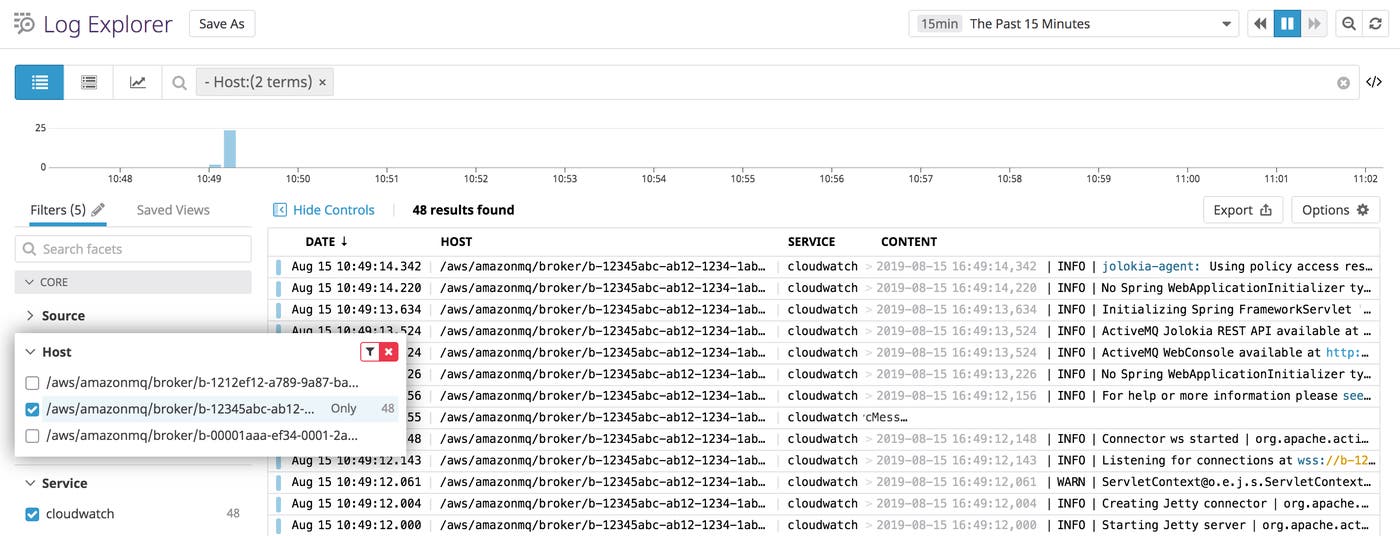
Datadog’s log pipeline automatically parses your CloudWatch logs to extract log attributes you can use to search and filter your logs in the Log Explorer.
In the screenshot below, the host attribute is available to use as a facet, making it easy to isolate logs from one or more brokers.
If you’ve tagged your logs, you can filter by any combination of tags to display a targeted subset of your logs. The screenshot below illustrates how you can use the search field in the Log Explorer to display only logs from the enrollment application.

Tie your logs to your metrics
When you apply tags to metrics and logs, you can then use those tags to explore metrics and logs in more meaningful ways. The screenshot below shows a graph of memory usage of all Amazon MQ destinations with the tag app:enrollment. You can click a point on the graph and select View related logs to easily see logs that share that tag.
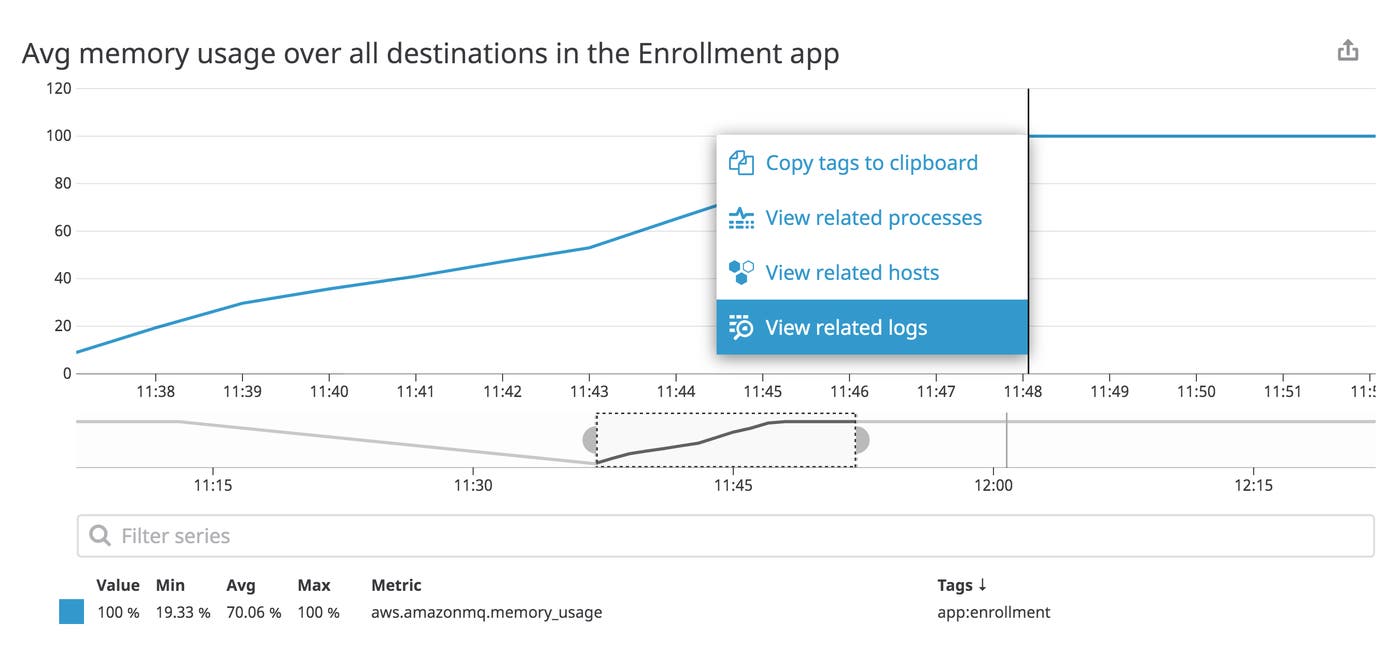
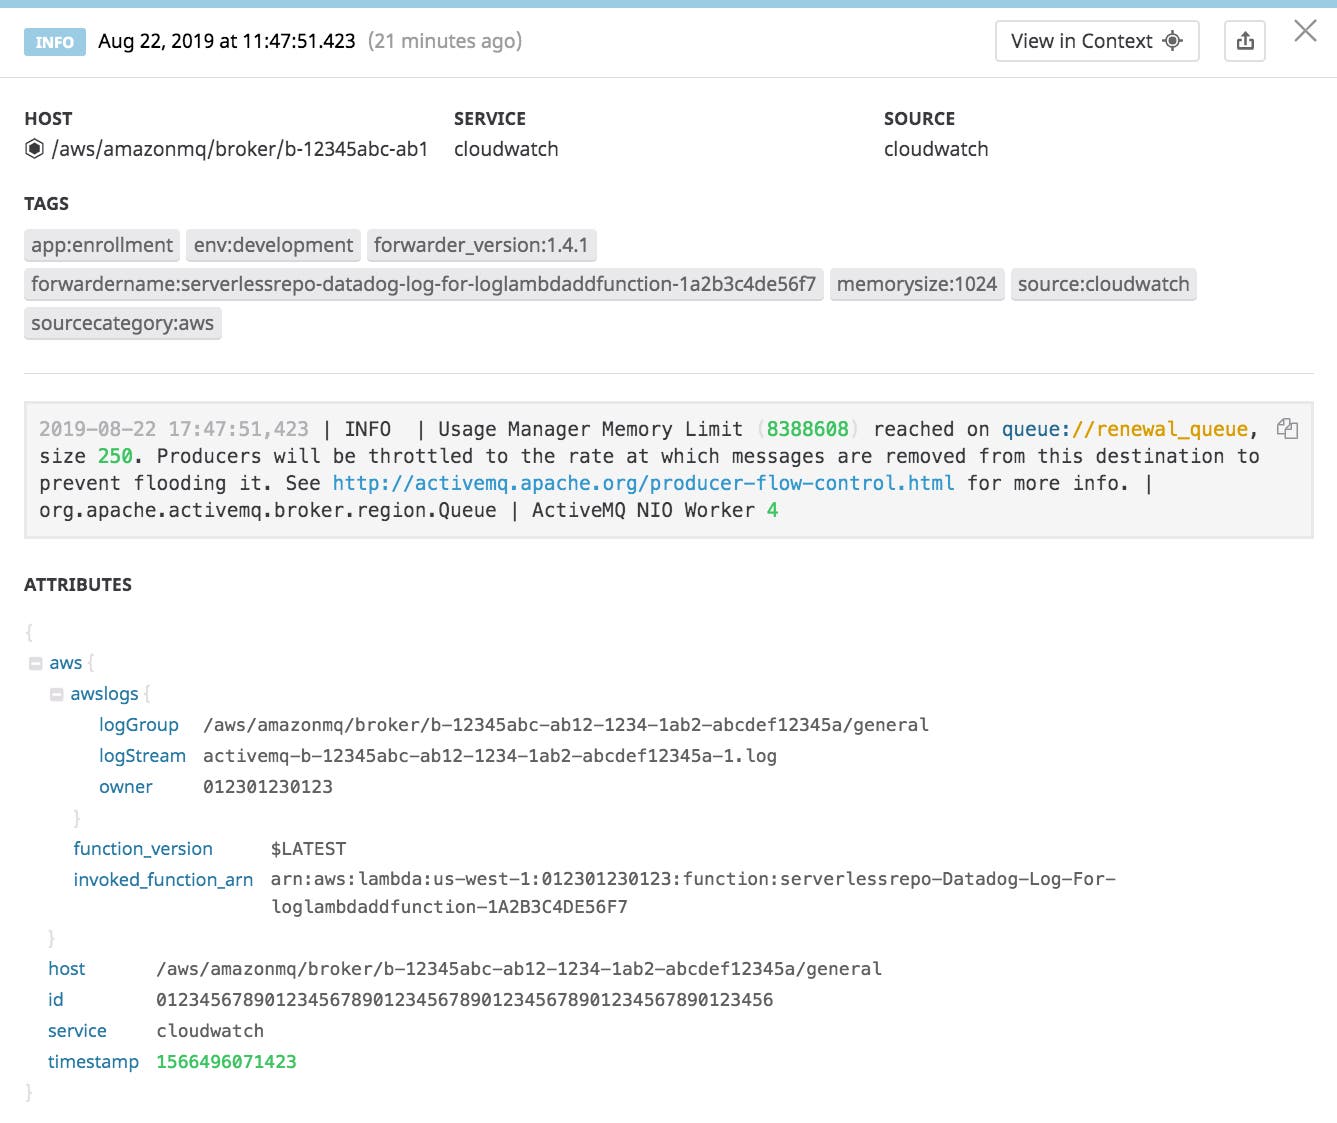
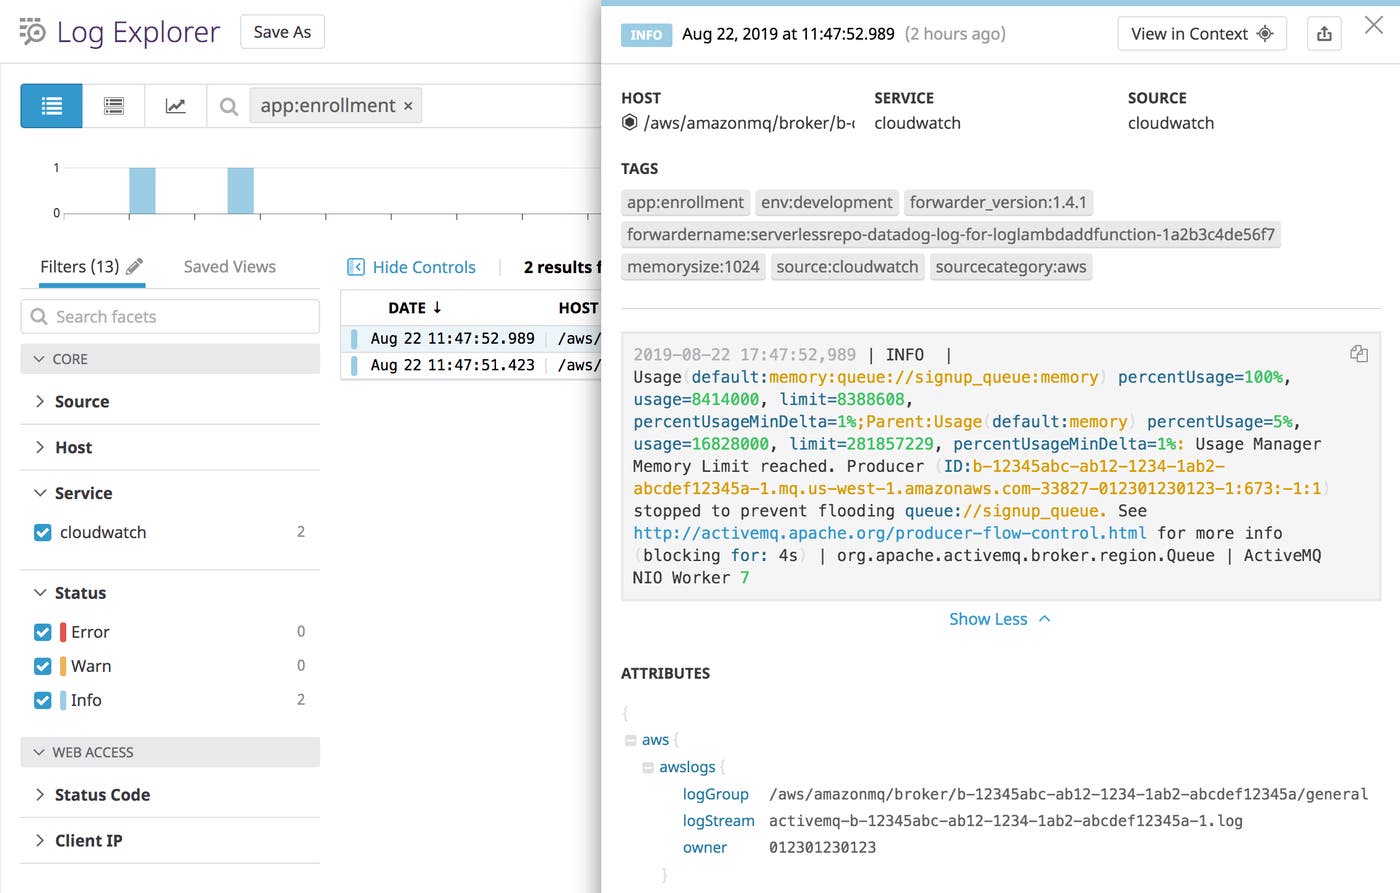
To learn more about the rising memory usage in the graph shown above, you can click View related logs to inspect the broker’s logs. The related log, shown below, indicates that producer flow control (PFC) has been triggered to prevent the producer from enqueuing more messages.
Use alerts to stay informed
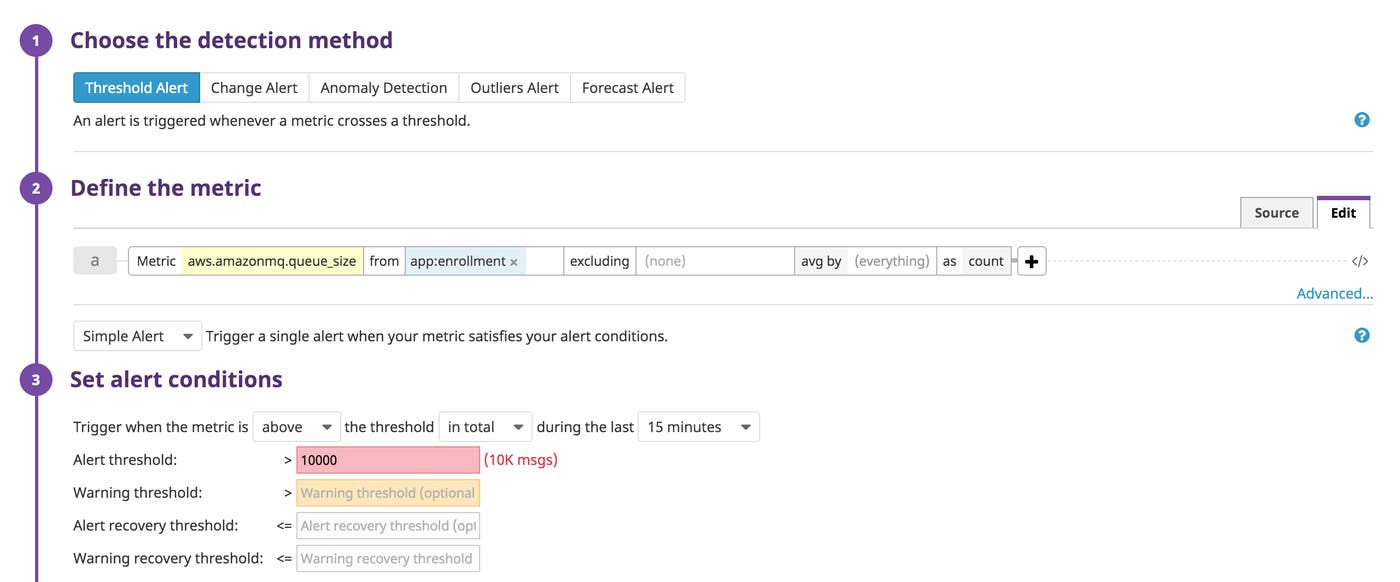
Alerts keep you informed of potential issues in your Amazon MQ infrastructure. You can use tags in your alert definitions to create alerts that are focused and actionable. The screenshot below illustrates how you could set up an alert that will trigger if the average queue size of destinations tagged app:enrollment rises above 10,000.
You can set up alerts to automatically monitor any of the key Amazon MQ metrics we identified in Part 1 of this series. The example below shows a forecast alert that will trigger if the disk space used by the broker to store persistent messages (aws.amazonmq.store_percent_usage) is expected to rise above 80 percent of its limit in the next week. If this alert triggers, you may need to move your broker to a larger instance type.

You can also create alerts based on your brokers’ logs to notify you of significant events such as a producer being blocked due to PFC. To make your log and metric alerts visible to your team, you can integrate your Datadog account with PagerDuty, Slack, and many other notification and collaboration services.
Monitor messaging and more
If the services in your distributed application coordinate their work by communicating through Amazon MQ, you need to ensure that your brokers and destinations are performing well. Datadog integrates with more than 1,000 technologies, giving you a single platform for monitoring all your applications, services, and infrastructure. If you’re not already using Datadog, you can start by signing up for a free 14-day trial.
Source Markdown for this post is available on GitHub. Questions, corrections, additions, etc.? Please let us know.


