Alexis Lê-Quôc
This post is part of a series on effective monitoring. Be sure to check out the rest of the series: Collecting the right data and Alerting on what matters.
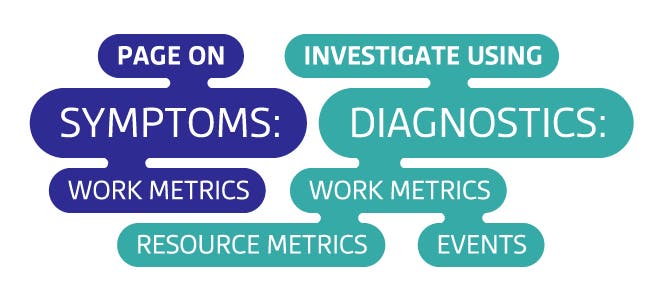
The responsibilities of a monitoring system do not end with symptom detection. Once your monitoring system has notified you of a real symptom that requires attention, its next job is to help you diagnose the root cause by making your systems observable via the monitoring data you have collected. Often this is the least structured aspect of monitoring, driven largely by hunches and guess-and-check. This post describes a more directed approach that can help you to find and correct root causes more efficiently.
This series of articles comes out of our experience monitoring large-scale infrastructure for our customers. It also draws on the work of Brendan Gregg, Rob Ewaschuk, and Baron Schwartz.
A word about data
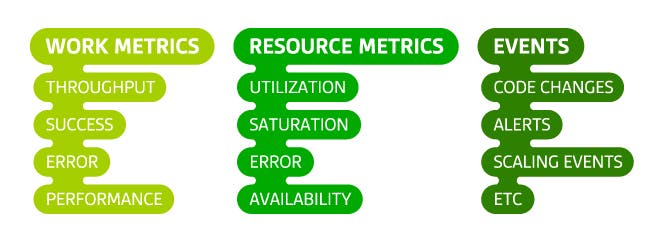
There are three main types of monitoring data that can help you investigate the root causes of problems in your infrastructure. Data types and best practices for their collection are discussed in-depth in a companion post, but in short:
- Work metrics indicate the top-level health of your system by measuring its useful output
- Resource metrics quantify the utilization, saturation, errors, or availability of a resource that your system depends on
- Events describe discrete, infrequent occurrences in your system such as code changes, internal alerts, and scaling events
By and large, work metrics will surface the most serious symptoms and should therefore generate the most serious alerts. But the other metric types are invaluable for investigating the causes of those symptoms. In order for your systems to be observable, you need sufficiently comprehensive measurements to provide a full picture of each system’s health and function.
It’s resources all the way down
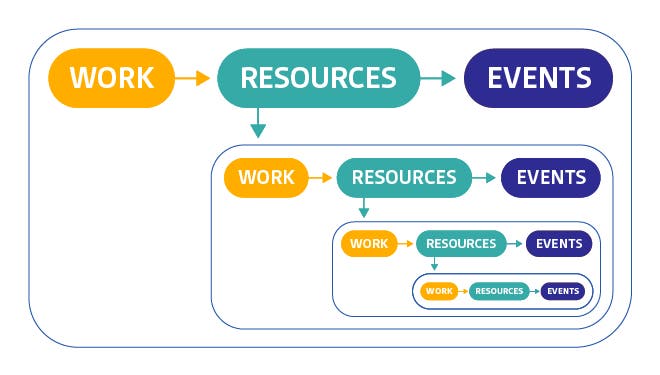
Most of the components of your infrastructure can be thought of as resources. At the highest levels, each of your systems that produces useful work likely relies on other systems. For instance, the Apache server in a LAMP stack relies on a MySQL database as a resource to support its work. One level down, within MySQL are database-specific resources that MySQL uses to do its work, such as the finite pool of client connections. At a lower level still are the physical resources of the server running MySQL, such as CPU, memory, and disks.
Thinking about which systems produce useful work, and which resources support that work, can help you to efficiently get to the root of any issues that surface. Understanding these hierarchies helps you build a mental model of how your systems interact, so you can quickly focus in on the key diagnostic metrics for any incident. When an alert notifies you of a possible problem, the following process will help you to approach your investigation systematically.
1. Start at the top with work metrics
First ask yourself, “Is there a problem? How can I characterize it?” If you don’t describe the issue clearly at the outset, it’s easy to lose track as you dive deeper into your systems to diagnose the issue.
Next examine the work metrics for the highest-level system that is exhibiting problems. These metrics will often point to the source of the problem, or at least set the direction for your investigation. For example, if the percentage of work that is successfully processed drops below a set threshold, diving into error metrics, and especially the types of errors being returned, will often help narrow the focus of your investigation. Alternatively, if latency is high, and the throughput of work being requested by outside systems is also very high, perhaps the system is simply overburdened.
2. Dig into resources
If you haven’t found the cause of the problem by inspecting top-level work metrics, next examine the resources that the system uses—physical resources as well as software or external services that serve as resources to the system. If you’ve already set up dashboards for each system as outlined below, you should be able to quickly find and peruse metrics for the relevant resources. Are those resources unavailable? Are they highly utilized or saturated? If so, recurse into those resources and begin investigating each of them at step 1.
3. Did something change?
Next consider alerts and other events that may be correlated with your metrics. If a code release, internal alert, or other event was registered slightly before problems started occurring, investigate whether they may be connected to the problem.
4. Fix it (and don’t forget it)
Once you have determined what caused the issue, correct it. Your investigation is complete when symptoms disappear—you can now think about how to change the system to avoid similar problems in the future. If you did not have the data you needed to quickly diagnose the problem, add more instrumentation to your system to ensure that those metrics and events are available for future responders.
Build dashboards before you need them
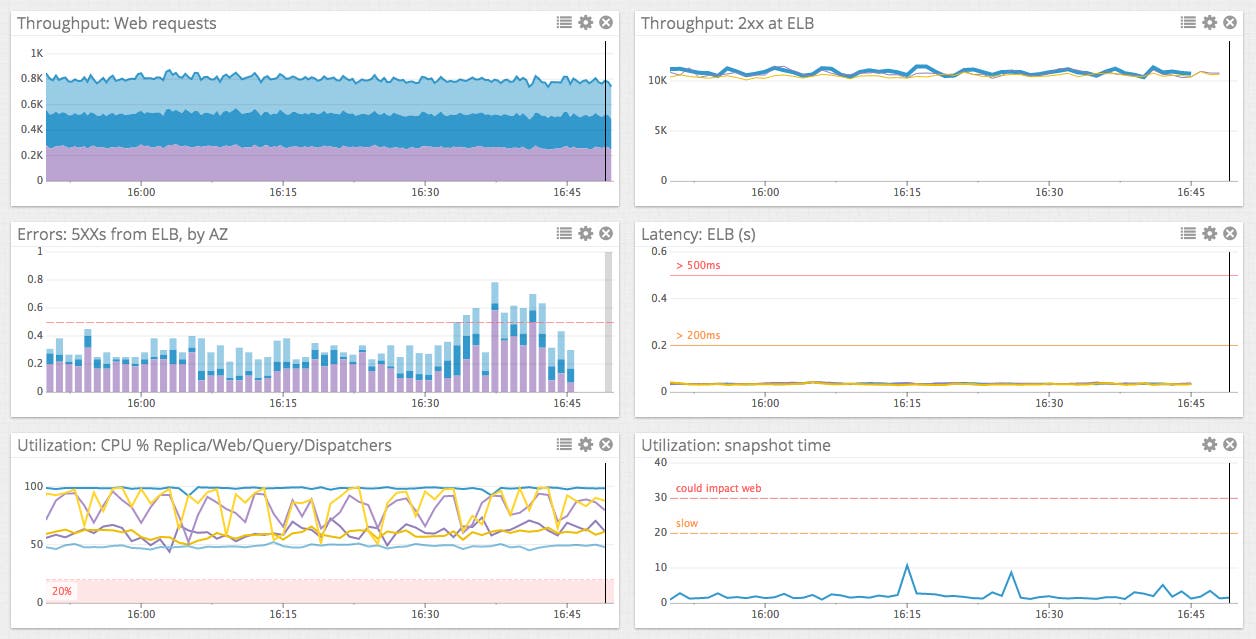
In an outage, every minute is crucial. To speed your investigation and keep your focus on the task at hand, set up dashboards in advance that help you observe the current and recent state of each system. You may want to set up one dashboard for your high-level application metrics, and one dashboard for each subsystem. Each system’s dashboard should render the work metrics of that system, along with resource metrics of the system itself and key metrics of the subsystems it depends on. If event data is available, overlay relevant events on the graphs for correlation analysis.
Conclusion: Follow the metrics
Adhering to a standardized monitoring framework allows you to investigate problems more systematically:
- For each system in your infrastructure, set up a dashboard ahead of time that displays all its key metrics, with relevant events overlaid.
- Investigate causes of problems by starting with the highest-level system that is showing symptoms, reviewing its work and resource metrics and any associated events.
- If problematic resources are detected, apply the same investigation pattern to the resource (and its constituent resources) until your root problem is discovered and corrected.
We would like to hear about your experiences as you apply this framework to your own monitoring practice. If it is working well, please let us know on Twitter! Questions, corrections, additions, complaints, etc? Please let us know on GitHub.

