Jean-Mathieu Saponaro
This post is part 3 of a 3-part series on how to best monitor Varnish. Part 1 explores the key metrics available in Varnish, and Part 2 is about collecting those metrics on an ad-hoc basis.
In order to implement ongoing, meaningful monitoring, you will need a dedicated system that allows you to store all relevant Varnish metrics, visualize them, and correlate them with the rest of your infrastructure. You also need to be alerted when anomalies occur. In this post, we’ll show you how to start monitoring Varnish with Datadog.

Integrating Datadog and Varnish
Verify that Varnish and varnishstat are working
Before you begin, run this command to verify that Varnish is running properly:
varnishstat -1 && echo -e "VarnishStat - OK" || \ || echo -e "VarnishStat - ERROR"Make sure the output displays “Varnishstat - OK”:

Install the Datadog Agent
The Datadog Agent is open-source software that collects and reports metrics from your different hosts so you can view, monitor and correlate them on the Datadog platform. Installing the Agent usually requires just a single command. Installation instructions for different systems are available here.
As soon as the Datadog Agent is up and running, you should see your host reporting metrics in your Datadog account.

Configure the Agent
Next you will need to create a Varnish configuration file for the Agent. You can find the location of the Agent configuration directory for your OS here. In that directory you will find a sample Varnish config file called conf.yaml.example. Copy this file to varnish.yaml, then edit it to include the path to the varnishstat binary, and an optional list of tags that will be applied to every collected metric:
init_config:
instances:
- varnishstat: /usr/bin/varnishstat tags: - instance:productionSave and close the file.
Restart the Agent
Next restart the Agent to load your new configuration. The restart command varies somewhat by platform; see the specific commands for your platform here.
Verify the configuration settings
To check that Datadog and Varnish are properly integrated, execute the Datadog info command. The command for each platform is available here.
If the configuration is correct, you will see a section like this in the info output:
Checks======
[...]
varnish
-----
- instance #0 [OK] - Collected 8 metrics & 0 eventsTurn on the integration
Finally, click the Varnish “Install Integration” button inside your Datadog account. The button is located under the Configuration tab in the Varnish integration settings.

Metrics!
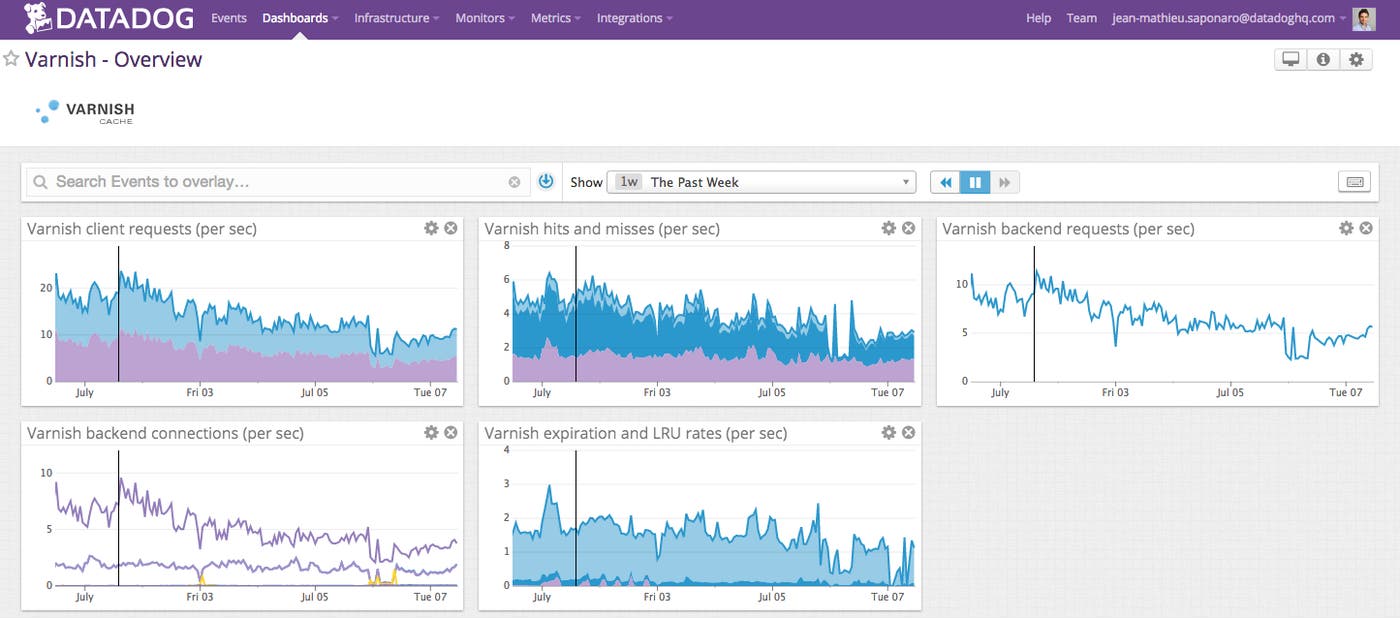
Once the Agent begins reporting Varnish metrics, you will see a Varnish dashboard among your list of available dashboards in Datadog.
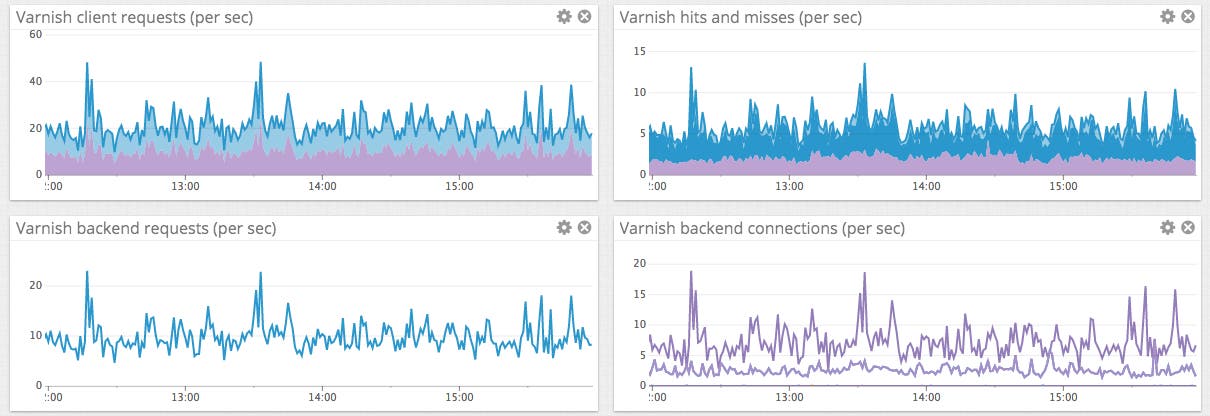
The basic Varnish dashboard displays the key metrics highlighted in our introduction to Varnish monitoring.

You can easily create a more comprehensive dashboard to monitor your entire web stack by adding additional graphs and metrics from outside systems. For example, you might want to graph Varnish metrics alongside metrics from your Apache web servers, or alongside host-level metrics such as network traffic. To start building a custom dashboard, clone the default Varnish dashboard by clicking on the gear on the upper right of the dashboard and selecting “Clone Dash”.

Alerting on Varnish metrics
Once Datadog is capturing and visualizing your metrics, you will likely want to set up some alerts to be automatically notified of potential issues.
Datadog can monitor individual hosts, containers, services, processes—or virtually any combination thereof. For instance, you can monitor all of your Varnish hosts, or all hosts in a certain availability zone, or a single key metric being reported by all hosts corresponding to a specific tag.
Below we’ll walk through a representative example: an alert on Varnish’s dropped connections.
Monitor Varnish’s dropped client connections
Datadog alerts can be threshold-based (alert when the metric exceeds a set value) or change-based (alert when the metric changes by a certain amount). In this case, we’ll take the first approach since we want to be alerted whenever the metric’s value is nonzero.
The sess_dropped metric counts client connections Varnish had to drop. There are several possible causes for dropped connections detailed in part 1, but regardless this metric should always be equal to 0.
-
Create a new metric monitor. Select “New Monitor” from the “Monitors” dropdown in Datadog. Select “Metric” as monitor type.

-
Define your metric monitor. We want to know when the number of dropped client connections per second exceeds a certain value. So we define the metric of interest to be the sum of
varnish.sess_dropped.
-
Set metric alert conditions. Since we want to alert on a fixed threshold, rather than on a change, we select “Threshold Alert.” We’ll set the monitor to alert us whenever Varnish starts dropping client connections. Here we alert whenever the metric has surpassed the threshold of zero at least once during the past minute. You should decide whether “greater than zero” is the right threshold for your organization, or whether some greater number of dropped connections is preferable to paging an engineer.

-
Customize the notification to notify your team. In this case we will post a notification in the ops team’s chat room and page the engineer on call. In the “Say what’s happening” section we name the monitor and add a short message that will accompany the notification to suggest a first step for investigation. We @mention the Slack channel that we use for ops and use @pagerduty to route the alert to PagerDuty.

-
Save the integration monitor. Click the “Save” button at the bottom of the page. You’re now monitoring a key Varnish work metric, and your on-call engineer will be paged anytime Varnish drops client connections.
Conclusion
In this post we’ve walked you through integrating Varnish with Datadog to visualize your key metrics and notify the right team whenever your web infrastructure shows signs of trouble.
If you’ve followed along using your own Datadog account, you should now have improved visibility into what’s happening in your web environment, as well as the ability to create automated alerts tailored to your infrastructure, your usage patterns, and the metrics that are most valuable to your organization.
If you don’t yet have a Datadog account, you can sign up for a free trial and start monitoring your infrastructure, your applications, and your services today.
Source Markdown for this post is available on GitHub. Questions, corrections, additions, etc.? Please let us know.


