Roman Olynyk
Tailscale is a modern remote access solution that allows customers to easily scale, segment, and manage a private network as their business grows. It enables encrypted point-to-point connections using the open source WireGuard protocol, so that devices on your private network can only communicate with each other. Tailscale users can grow their private networks— called tailnets—by adding users and devices as needed, or limit what network resources any user or device can access using Tailscale’s identity-aware access control list capabilities.
Tailscale generates extensive usage records through tools such as tailnet lock, audit logs, and network flow logs, and monitoring this data can help you better understand user activity and trends in your network so you can identify security gaps or suspicious activity. Today, Datadog and Tailscale are announcing a new integration that helps tailnet administrators easily visualize log activity and set up alerts for suspicious or sensitive events as they happen.
In this post, we will show how you can use this new integration to:
- Visualize the flow of traffic in your tailnet
- Configure recommended and custom monitors to receive useful alerts
Visualize tailnet network flow logs in Datadog
Once you configured the integration and your Tailscale network flow logs are streaming into Datadog, you can use our out-of-the-box (OOTB) Tailscale dashboard to analyze the flow of traffic in your tailnet. These insights can help you identify traffic patterns, spot potential performance issues, and pinpoint suspicious activity for investigation and analysis.
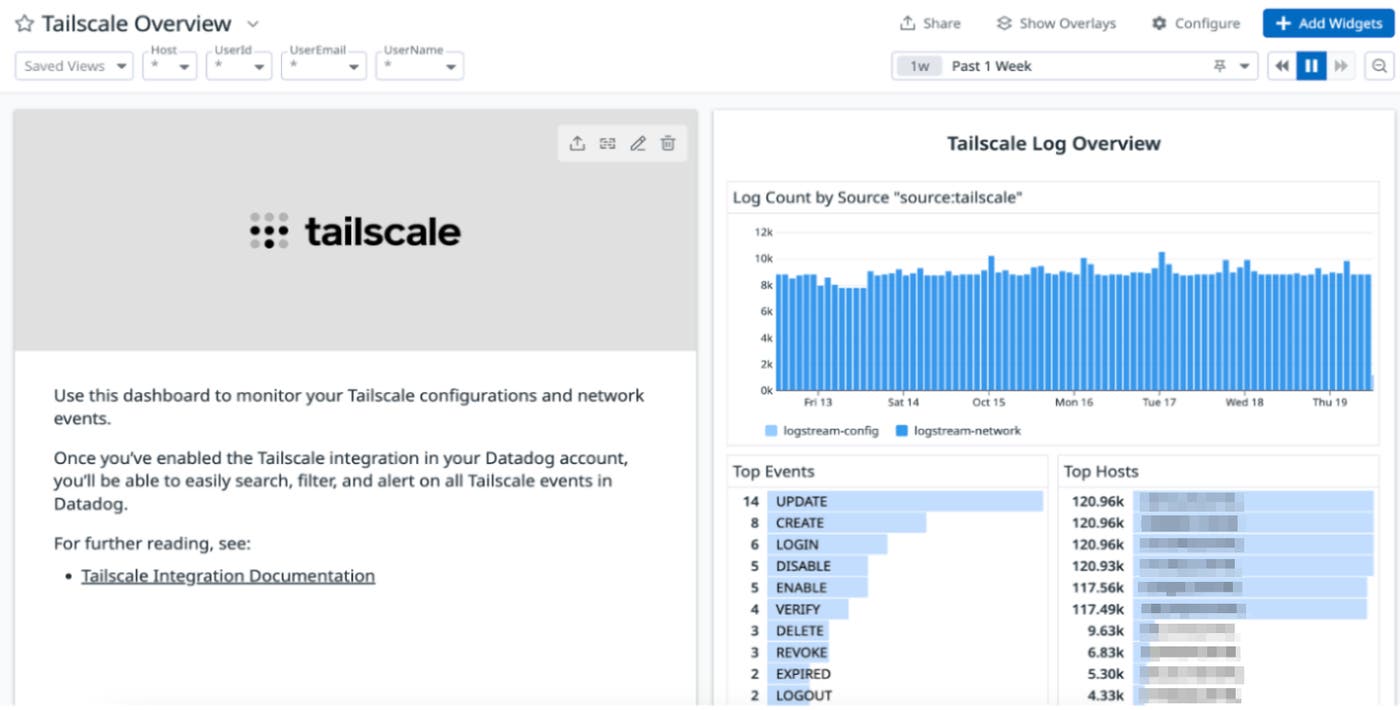
In the Tailscale Log Overview section, you can find high-level insights into the logs your network is generating, including total log count, most common events, and hosts experiencing the highest levels of activity.
You can also leverage insights from this dashboard to understand how much traffic is flowing through your tailnet in any given period of time and drill down to specific IPs, ports or even devices that are sending or receiving traffic. Let’s say you noticed a higher-than-usual traffic volume on port 22, a potential sign of an SSH tunneling or port forwarding attempt. You can use the OOTB Tailscale dashboard to drill down to specific IPs or devices that are responsible for this concerning traffic pattern and investigate further about the nature of this transfer.
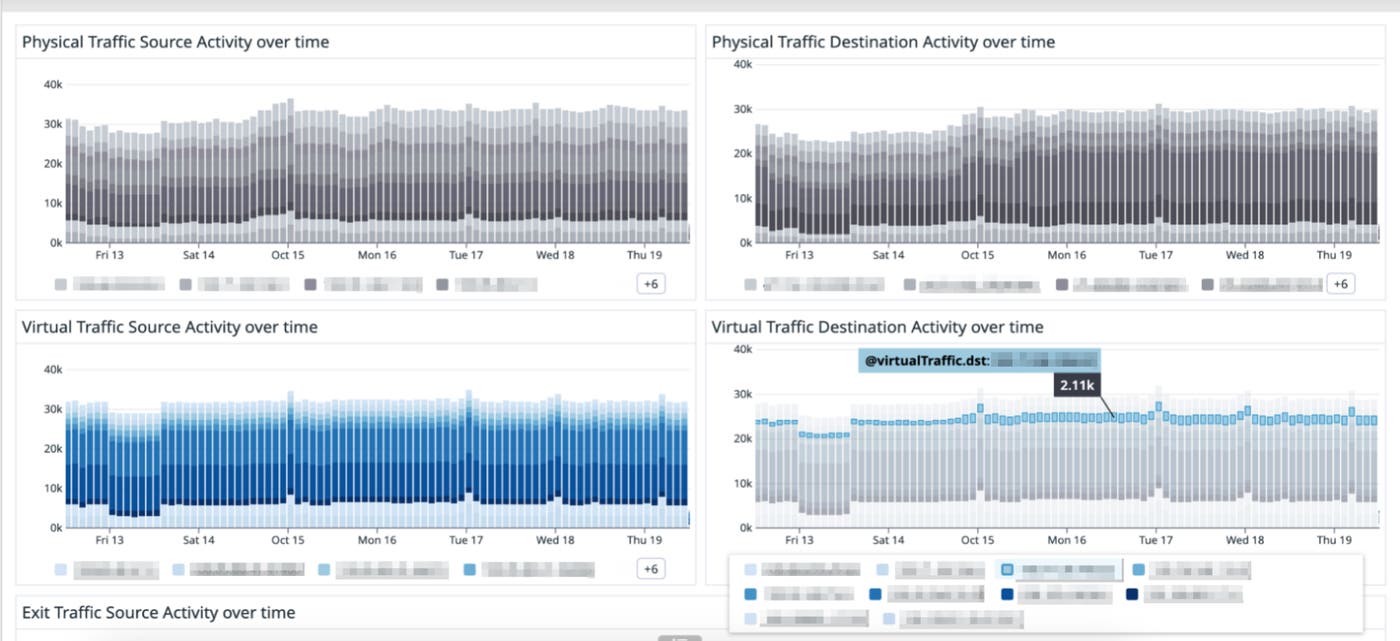
With these and other metrics available in the Tailscale dashboard in Datadog, you have a single pane of glass through which you can monitor traffic patterns, quickly spot anomalies that could indicate performance issues, and identify potential security threats to triage or investigate.
Configure our recommended monitors to receive useful alerts
Datadog’s Tailscale integration comes with out-of-the-box, preconfigured monitors that will generate alerts when we detect potential sensitive changes or anomalous traffic patterns in your tailnet. These monitors will alert you if traffic over a specific port and/or IP goes beyond the threshold you have set
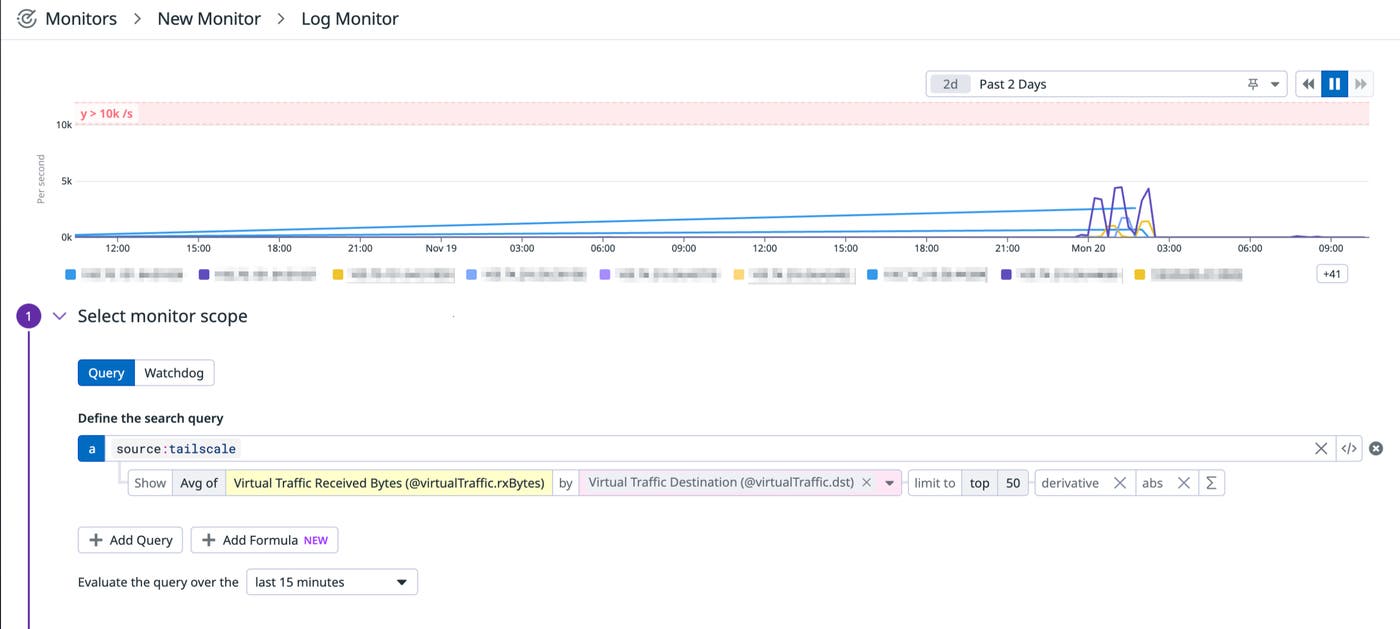
You can also set up monitors that will alert you to changes to your tailnet including when user or device approvals are disabled, when logs are disabled, and other actions you may want to be notified of.
For example, say you are a security administrator at an organization using a Tailscale private network, and you want to be notified any time a Tailscale API call is made by a user that lacks sufficient permissions, as this could indicate an attempt at unauthorized activity in your tailnet. With Datadog’s Tailscale integration, you can set a monitor in Datadog that alerts you any time an API call yields a failed request.
Once you’re notified of this activity, you can investigate further and identify the IP address or user that made the request. If they are a known, legitimate user within your organization, you can reach out to them to understand what action they were trying to take and help them do so securely. Or, if you suspect the call was made by an attacker, you can block that user while you continue your investigation to determine how they may have gained access.
Start monitoring your tailnet for anomalies and threats
If you rely on Tailscale to manage device communications on your network, ensuring your tailnet is performant and secure is critical to keeping day-to-day operations going smoothly. With the Tailscale integration in Datadog, you can monitor and alert on key metrics surrounding activity in your tailnet, so you can identify patterns that could indicate suspicious activity or performance issues that need to be investigated further.
Set up the integration to get started today. If you’re new to Datadog, you can sign up for a 14-day free trial.


