Paul Gottschling
Systemd is an initialization program that manages processes on Linux systems. It was designed to improve the performance of its predecessors by creating a dependency tree of system components, initializing them only when needed, and using as much parallelization as possible. With systemd becoming ubiquitous in Linux distributions, it’s crucial that you monitor the health and performance of both systemd and the components that it manages. We’re pleased to announce that our new integration with systemd provides comprehensive visibility into system management within your Linux deployments.
It’s 10 p.m.—do you know where your units are?
Systemd constructs its dependency tree by assigning system components to logically connected units. Some units are services, which represent processes. Other units are sockets, which systemd initializes separately from the processes that rely on them. You can use Datadog to get fine-grain visibility into the units that systemd manages and find out if they are unhealthy.
Datadog’s systemd integration provides detailed metrics for the status of your units. You can track system-wide counts of active, activating, inactive, deactivating, and failed units over time (systemd.units_by_state), compare these counts to the total number of units, and see whether system processes have encountered issues.
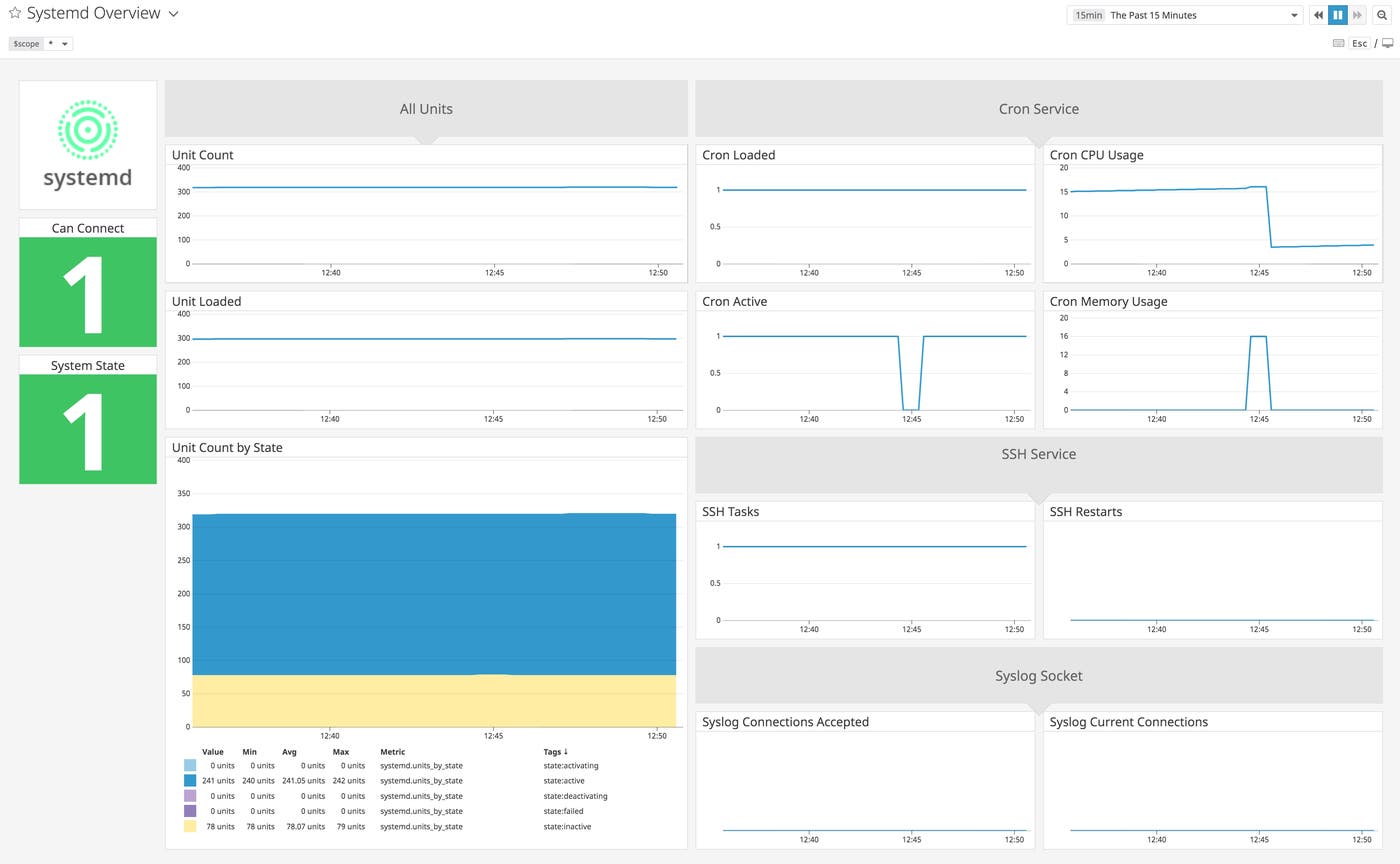
You can also troubleshoot process initialization by using the unit tag to track the systemd.unit.active and systemd.unit.loaded metrics, letting you know how long specific units have spent in each state. Custom dashboards like the one below can help you investigate possible unit-level issues. In the “Active units” graph, for example, you can see that one service initialized but, soon after, stopped being active.

The integration includes an out-of-the-box dashboard for systemd that surveys per-unit metrics across your infrastructure, with a special focus on commonly used units like cron, SSH, and syslog. (You can customize the dashboard to show other units as well.)
Stay on top of unit health
If one of your units fails, you’ll want to know as soon as possible so you can take action. Datadog’s systemd integration runs a service check that returns the state of each systemd unit and reports a CRITICAL status if the unit is inactive, deactivating, or failed. You can view a summary of service checks to get an overview of unit-by-unit health.
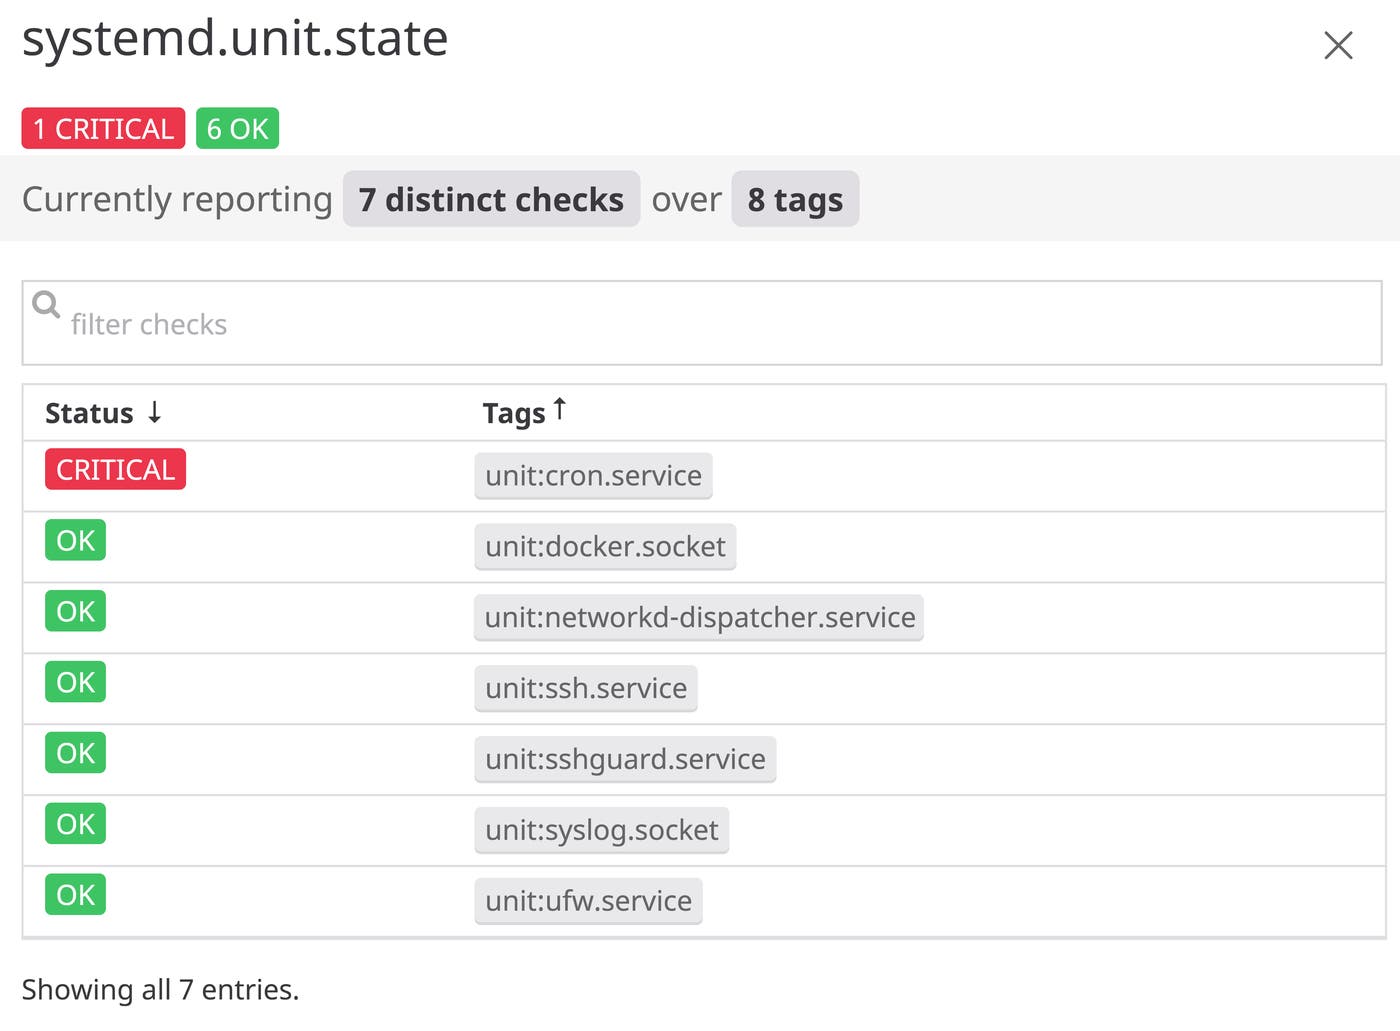
Our integration also uses service checks to detect if Datadog can no longer connect to systemd, as well as if systemd is unavailable. You can notify your team automatically if one of our service checks reports a CRITICAL status by setting alerts.
Keep your resources under control
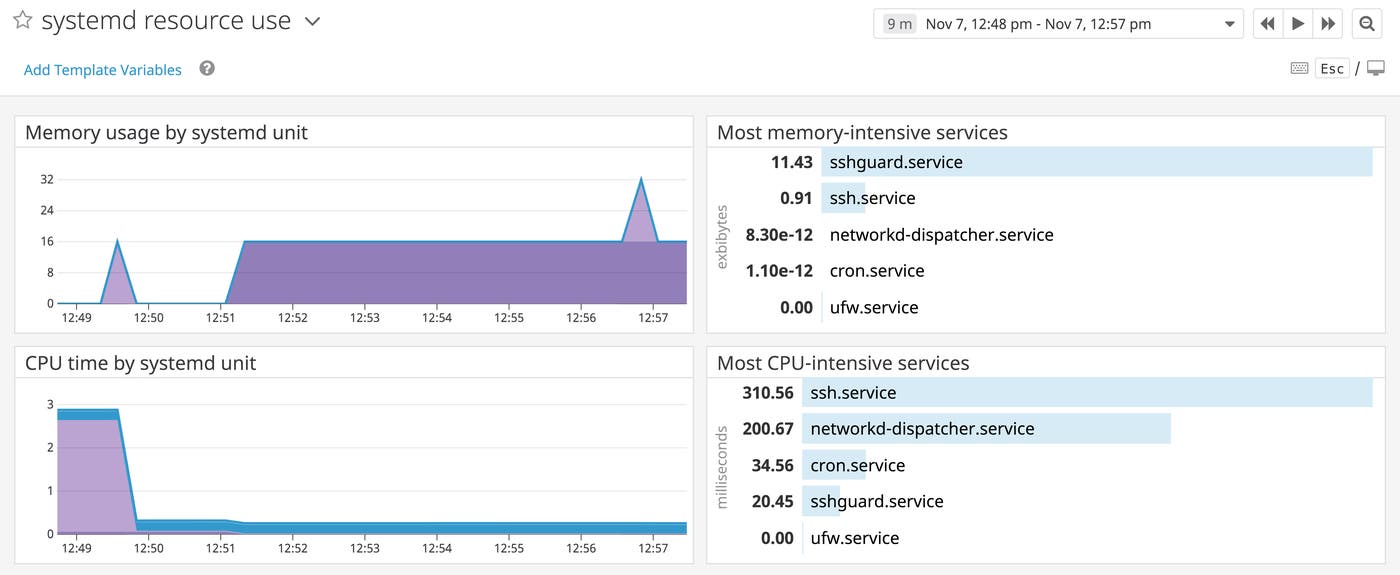
You can prevent a single unit from hogging system resources by configuring systemd to impose memory and CPU limits. If a unit exceeds a resource limit, systemd will attempt to terminate its processes. You can use Datadog to visualize per-unit resource consumption over time, helping you understand typical usage levels and set reasonable limits.
See what runs and save what doesn’t
Now that Datadog integrates with systemd, you can get close-ups of health and performance on your Linux hosts, enabling you to diagnose issues with process management more easily. You can get even more visibility by using Datadog’s Live Process and Live Container views. And for insight into the applications systemd manages, you can use any of our 1,000 integrations. To start monitoring systemd and the rest of your infrastructure, sign up for a 14-day free trial.


