Noah Zoschke
This is a guest post by Noah Zoschke, Engineering Manager at Segment.
Segment is the customer data infrastructure that makes it easy for companies to clean, collect, and control their first-party customer data. At Segment, our ultimate goal is to collect data from Sources (e.g., a website or mobile app) and route it to one or more Destinations (e.g., Google Analytics and AWS Redshift) as quickly and reliably as possible.
We developed a metrics pipeline and API to provide our users with real-time insights into the performance and reliability of their data pipelines—and we’ve partnered with Datadog to release a new integration that helps users monitor Segment delivery data alongside the rest of their infrastructure.
In this blog post, we’ll share:
- Why we developed the metrics pipeline
- How Segment delivers this data at scale
- How to use Datadog + Segment to monitor your customer data infrastructure
Why we developed the metrics pipeline
After collecting 350 billion events every month, we find that our customers always ask the same question: Exactly how fast and how reliable is that data delivery? Definitively answering this question is difficult. Segment delivers more than 24 billion outbound events every day—and the journey for each individual event can be complex and unpredictable. Each event first comes in through our Tracking API. From there, our infrastructure processes and validates it in milliseconds. And then…it hits the internet. As we’re delivering that data to an API, it may hit an intermittent failure, a connection reset, or some sort of authentication issue.
Failures might be global (e.g., Segment is experiencing an outage) or specific to a Source or Destination. A Source’s user data volume may spike and trigger rate-limiting errors, while a Destination’s partner API may experience an outage.
So to answer this question, we built a metrics pipeline that can measure, aggregate, and store data about the 24+ billion outbound events we deliver every day. It collects metrics for every Source-Destination pair so our users can track the unique delivery status of their data to their Destinations. It then exposes this data in the Segment Config API, which powers an event delivery overview dashboard in Segment, and real-time monitoring and alerting via our new Datadog integration. Customers can also use the API directly to build custom tools.
With all this, Segment provides a definitive answer to the question of how fast and reliable data delivery is. We have a global view of the real-time status of hundreds of partner APIs. But most importantly, we give our users the ability to monitor the status of the data they are sending to their Destinations, and investigate errors in just a few clicks.
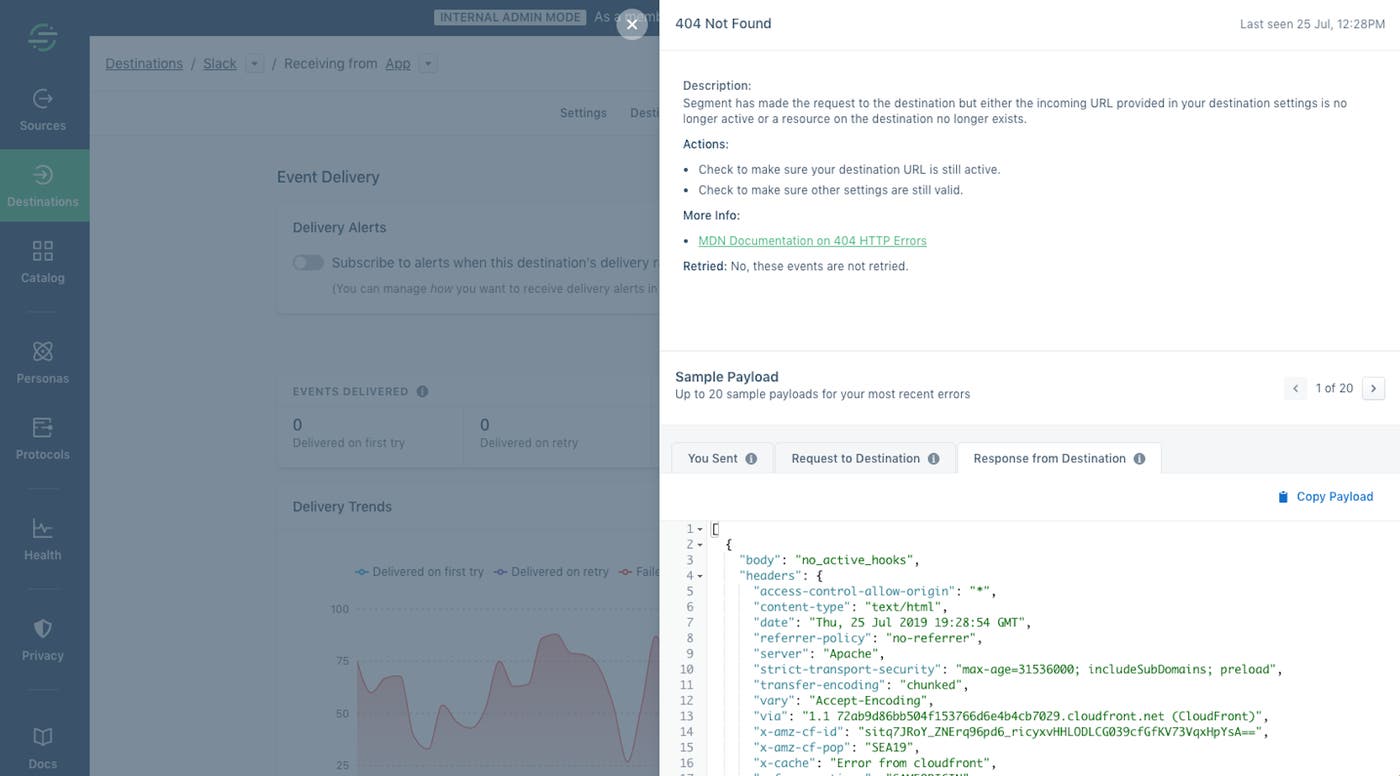
Users can quickly visualize if a Destination is having service problems and the effect that has on their data, and set up alerts if this isn’t meeting their quality of service goals. The result is a unique real-time status page for the internet, and confidence in using Segment for customer data infrastructure.
How Segment delivers data at scale
We’d like to share a few details about the architecture that supports this metrics pipeline. We use Kafka to process and collect metrics about delivery, AWS Aurora MySQL to aggregate metrics, and a REST API service to expose it as timeseries data. As we set out to build this pipeline, we wanted to make sure that problems with a single customer (like a spike in volumes) and problems with a single Destination (like downtime or rate-limiting) would not affect any other customer.
To tackle this challenge, we built a “Centrifuge” system that is responsible for coordinating and improving the reliability of our delivery streams. You can learn more about its architecture in our in-depth blog post. After Centrifuge captures the delivery data, we use Kafka to process it into metrics. The metrics pipeline uses Kafka consumer groups and ECS Auto Scaling to process all the data, and a sharded MySQL metrics cluster makes it easy to aggregate all the data.
Finally, we need to expose the data. The Segment Config API includes Event Delivery Metrics APIs that expose success, error, and latency metrics. Data is available at different levels of granularity (minute, hour, and day), as determined by the user-supplied start time and end time in each API call.
Visualize and alert on event delivery metrics and errors
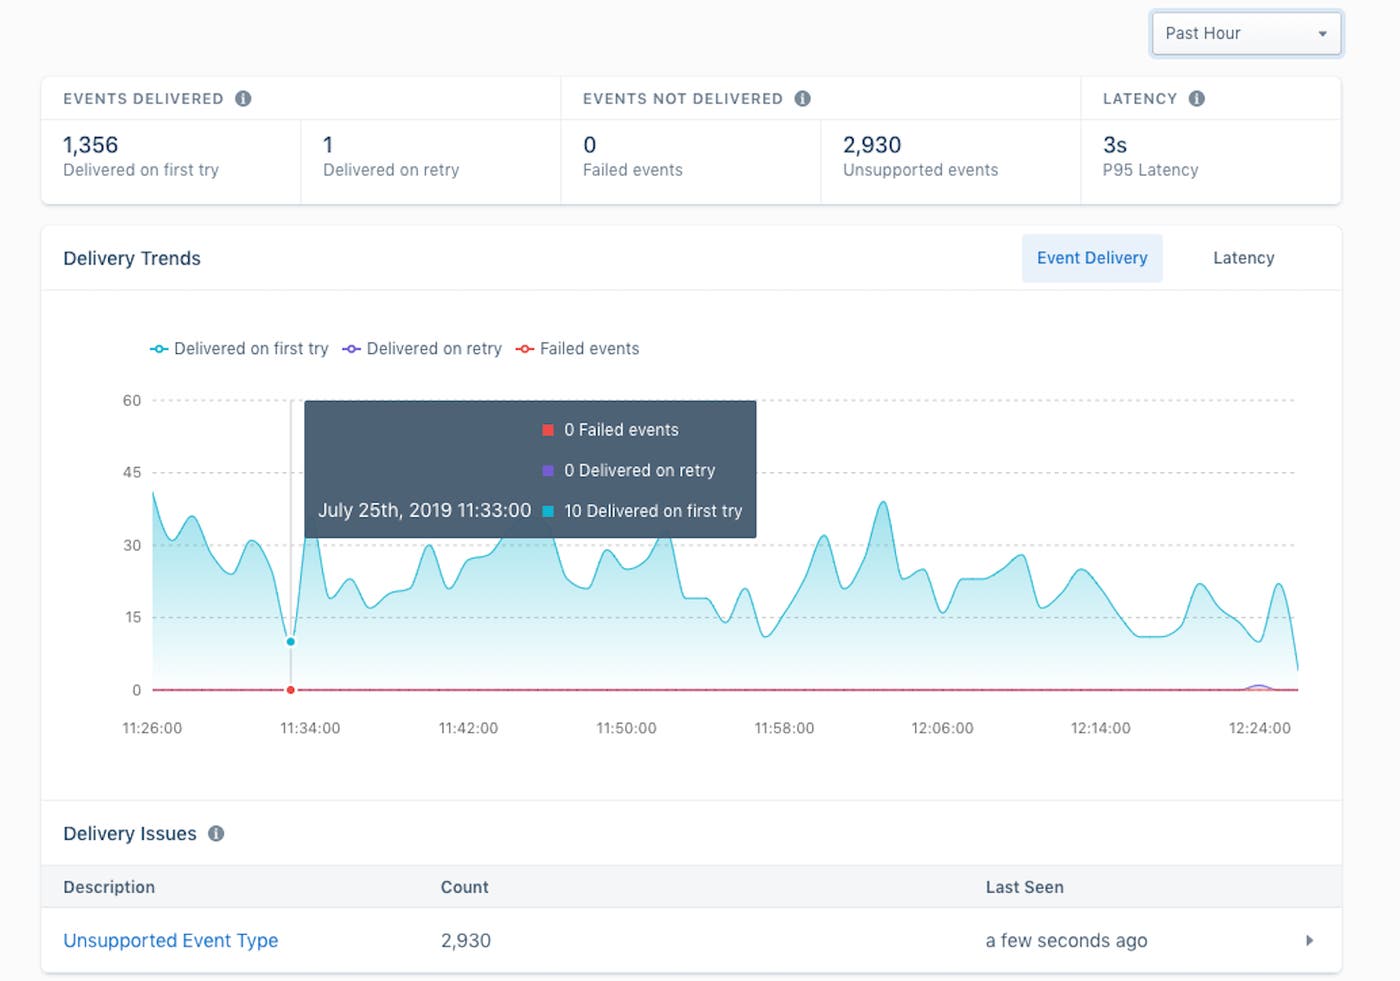
Once all your event delivery data is accessible through the Segment API, you can visualize it and analyze it to get deeper insights into your data pipelines. In your Segment account, you can view a dashboard of metrics and errors, and then drill down to see delivery trends and issues.
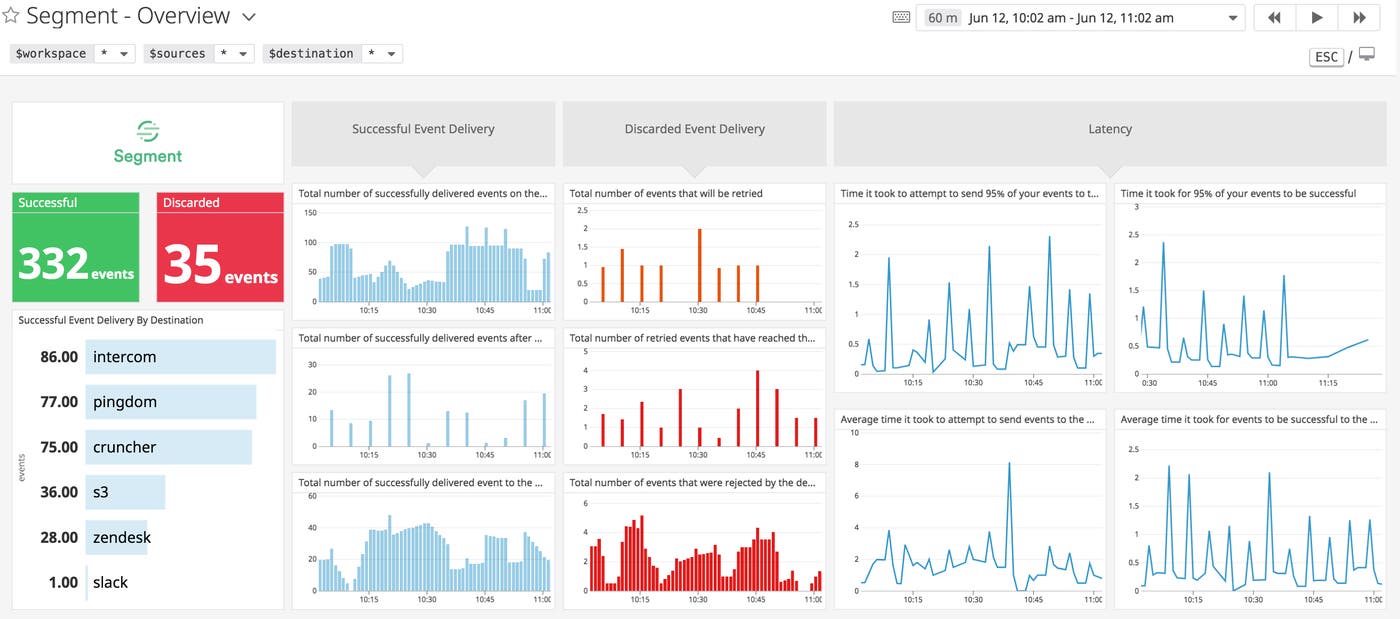
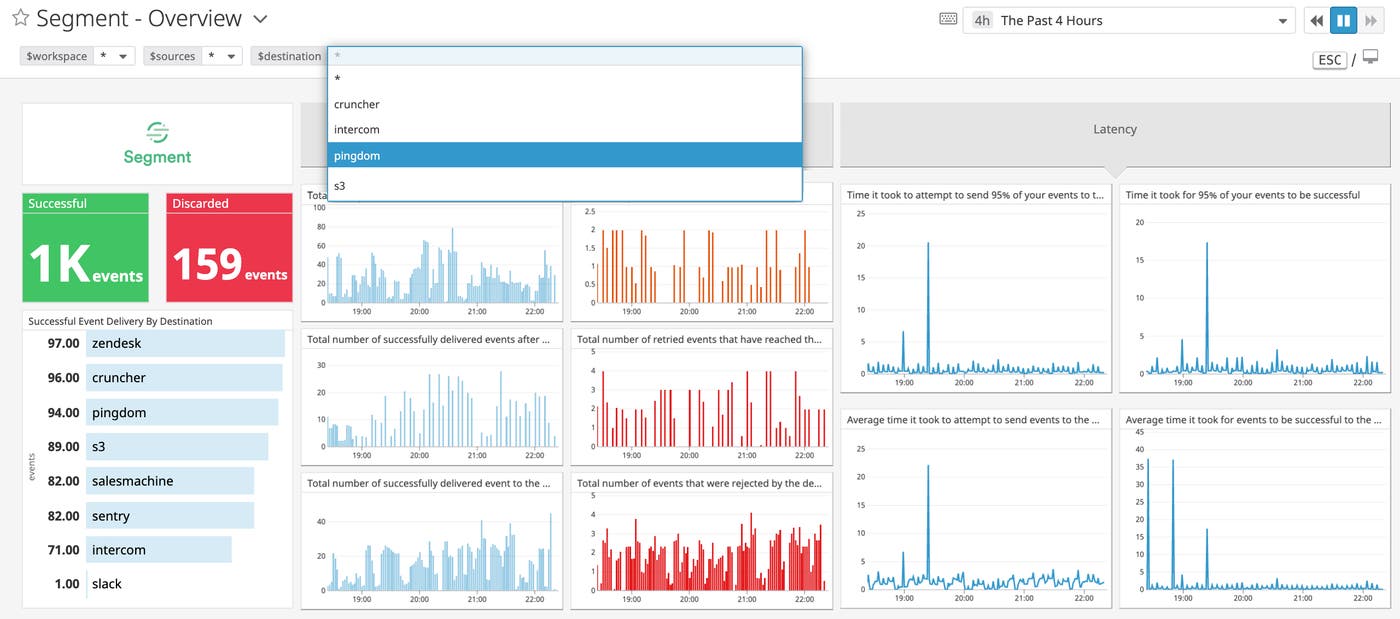
But since the data is available over an API, you are not limited to Segment’s visualizations. Datadog now integrates with Segment so you can visualize and alert on delivery data. The integration includes an out-of-the-box dashboard that provides an overview of delivery data across an entire workspace. You can also filter to view data associated with a specific workspace, source, or destination by using the template variable selector in the upper-left corner of the dashboard.
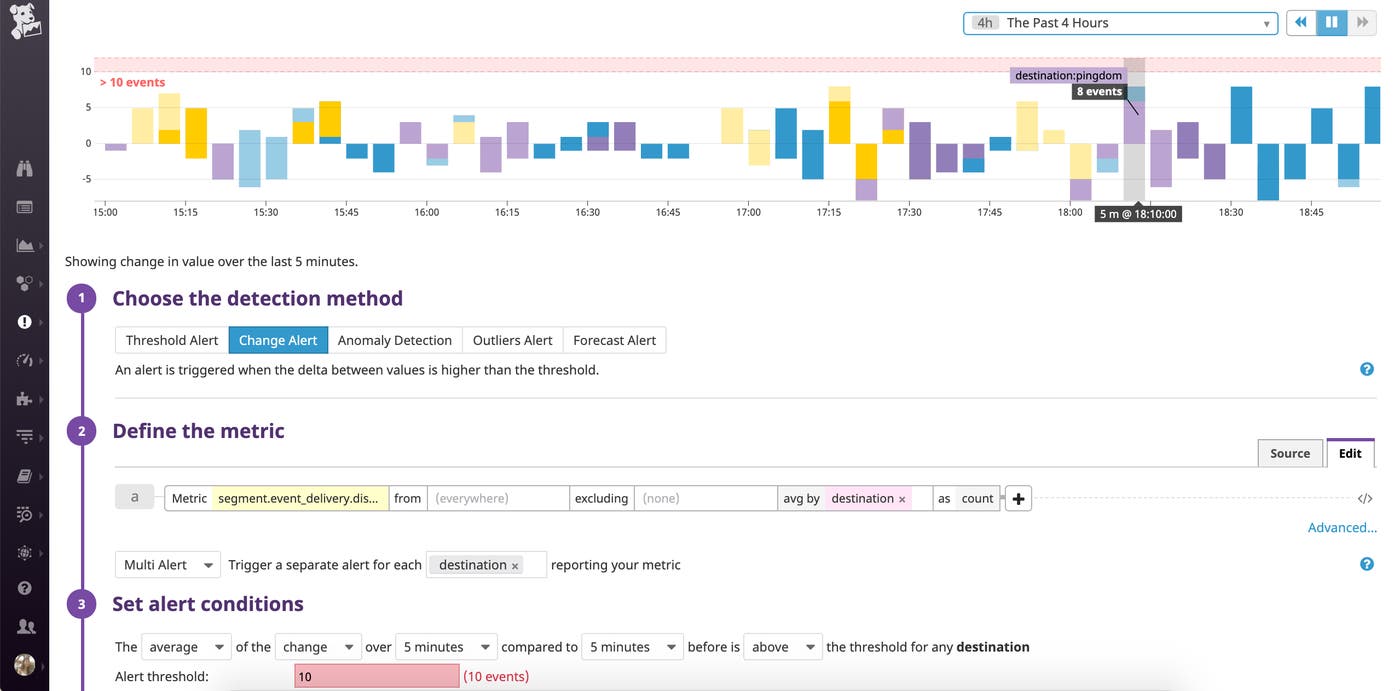
Your customer journey and data pipelines are a core piece of infrastructure—it’s time to treat them like one. Thanks to our new integration, you can tap into Datadog’s monitoring to automatically get alerted about event delivery problems. This means you can immediately find out if one of your critical data pipelines goes down or set up anomaly detection to quickly take action if something goes wrong. For example, you can set a change alert to detect a spike in the number of events rejected by any Destination (segment.event_delivery.discarded) over the last five-minute period.
Deeper insights into your data pipelines
Delivering data at scale—and collecting metrics about the health and performance of those pipelines along the way—poses many challenges. But thanks to our new metrics pipeline, we’re able to capture, process, and expose real-time event delivery data through an API, so that our customers can derive insights from that information. They can also understand how a single Destination is operating with Segment’s built-in dashboard. With Datadog’s integration, our users can analyze how all of their Destinations are doing in aggregate, and build completely custom dashboards and alerts to track the real-time health of their data pipelines.
With our metrics pipeline—and new Datadog integration–we’re excited to provide our users with a definitive view of the status of all of their Segment data pipelines, and help them build confidence in their customer data infrastructure.
