

Redis is an in-memory key-value data store that offers fast performance, flexible data structures, and multi-model databases, allowing it to handle a variety of use cases. Redis Enterprise enhances open source Redis with features designed to run distributed applications at scale, such as multi-tenancy, tiered data storage, active-active cluster replication, and support for up to five 9s of availability.
Our new Redis Enterprise integration provides vital KPIs for Enterprise-specific features, helping you monitor the health and efficiency of your databases. You can access a variety of out-of-the-box dashboards, including the Cluster Top View dashboard below, to evaluate the state of your cluster. In this article, we’ll explore how this integration allows you to:
- Optimize database performance across your cluster
- Visualize the health of your Redis Enterprise clusters
Optimize database performance across your cluster
Database clustering in Redis Enterprise enables you to distribute your databases across multiple nodes for linear scalability over both CPU and RAM.
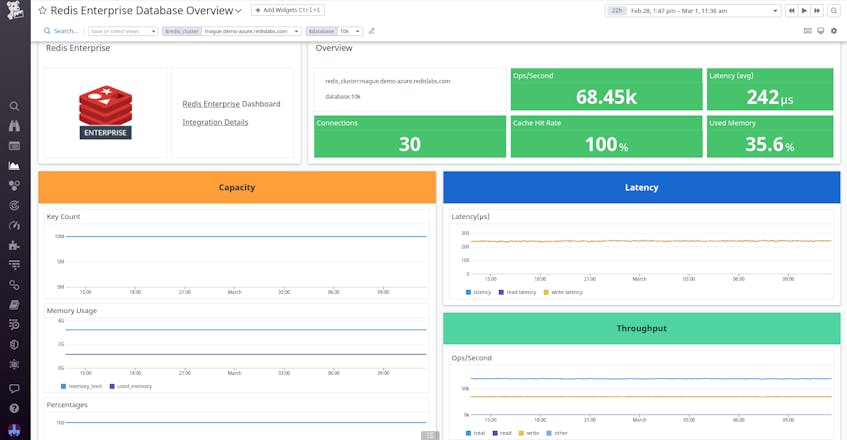
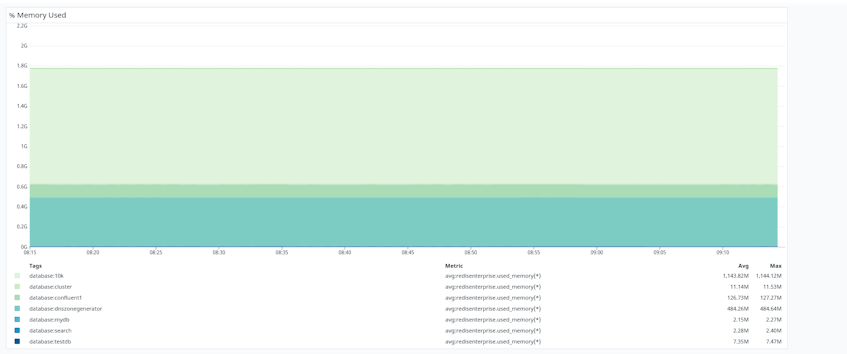
The Redis Enterprise integration provides dashboards that help you track performance for all multi-tenant databases in your clusters. The Database Overview dashboard displays capacity metrics, such as RAM utilization, to help you gain insight into your workload–and the ability of your Redis database to handle it. The dashboard also enables you to track metrics like latency and cache-hit ratios, so you can proactively identify problems and ensure a smooth user experience.
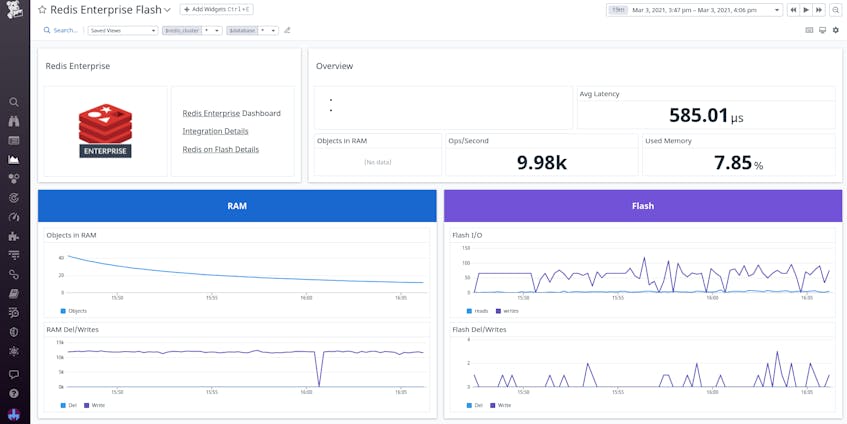
Redis Enterprise supports multi-tier storage through Redis on Flash (RoF), reducing storage costs without impacting overall performance. The new Redis Enterprise Flash dashboard allows you to visualize internal tiering metrics as data is moved between RAM and SSD storage. It also displays other metrics, such as average latency across your RoF databases, that can help you quickly assess the performance of your cluster.
To stay on top of issues, you can create monitors that alert you when KPIs fail to meet performance standards. When a monitor notifies you of unusual activity, you can dig into metrics to determine the root cause and assess possible remediation strategies. For example, you can set up an alert to get notified when memory usage exceeds 80 percent, the Redis-recommended threshold. If you get alerted, you can check whether there has been a recent spike in the number of operations per second or if data is being evicted. You can then decide whether you need to take action to remediate the issue (e.g., by raising the memory limit of your database). Datadog also tracks significant cluster events, such as upgrades, deletions, and failovers, so you have complete context for rapid troubleshooting.
Visualize the health of your Redis Enterprise clusters
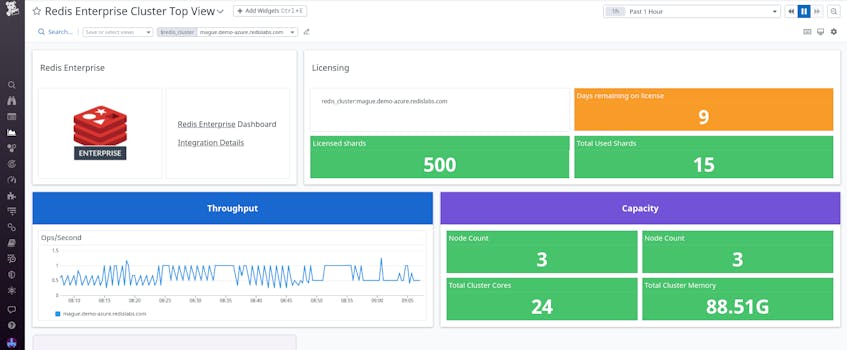
For a complete picture of system health, you need deep visibility into your entire Redis Enterprise cluster. The integration gathers crucial metrics into a Cluster Top View dashboard, supplying a quick summary of the state of your system. Shard counts help you manage how your data is distributed, while capacity data—such as node counts and memory usage (shown below)—help you evaluate whether your cluster has sufficient resources to handle your workload.
You can also pivot to the Database Overview dashboard to see if certain databases are consuming more resources than the rest, allowing you to identify and prioritize areas of optimization.
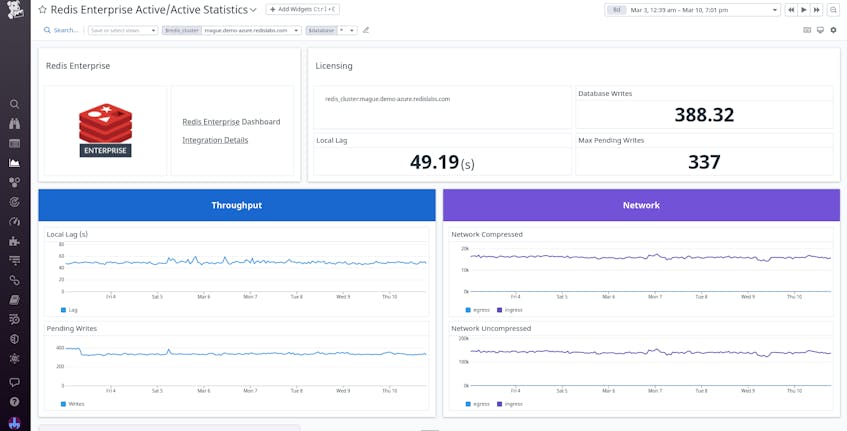
Additionally, the integration helps you ensure that your databases are highly available and consistent. Redis Enterprise enables you to create geo-distributed Active-Active databases that make it easy to deploy your application across regions, giving you improved reliability and performance. Active-Active databases use Conflict-free Replicated Data Types (CRDT) to keep your data centers in sync. The Active-Active Statistics dashboard allows you to monitor pending writes and lag time, so you can make sure your databases aren’t drifting apart. You can also monitor incoming and outgoing network traffic, which can be a potential indicator of database issues.
Get started with the Redis Enterprise integration
With comprehensive metrics and out-of-the-box dashboards, Datadog provides insight into the health and performance of your Redis Enterprise clusters. The integration comes with automated discovery of multi-tenant databases for simple setup.
Check out our documentation to start monitoring your Redis Enterprise clusters. If you’re new to Datadog, you can sign up for a 14-day free trial.
