

ProxySQL is a MySQL/MariaDB protocol–compliant load balancer and reverse proxy with native support for a range of popular backends including ClickHouse, Amazon Aurora, and Amazon RDS. ProxySQL efficiently distributes queries to your database servers and caches results, improving resource management and boosting database performance. You can also configure ProxySQL for high availability to reduce downtime.
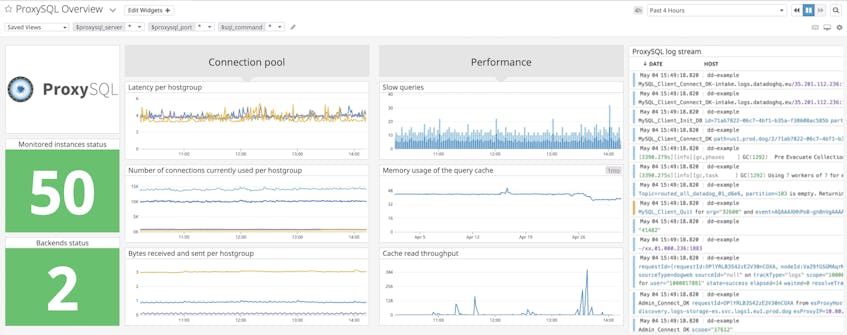
Because ProxySQL is the primary gateway for queries to your database, it’s important to monitor it carefully. If ProxySQL performs poorly, you’ll see increased latency and performance degradation across the parts of your stack that depend on it. With Datadog’s integration, you can ensure ProxySQL continues running smoothly by visualizing, monitoring, and alerting on dozens of key metrics like memory usage and query throughput. Those metrics are included in our out-of-the-box ProxySQL dashboard to make it easy to track the performance and resource usage of your proxy.
Keep track of ProxySQL query cache efficiency
ProxySQL is commonly used as a query cache to expedite transactions between clients and your database servers. You can enable query caching by providing a value (in milliseconds) for the cache_ttl property in ProxySQL’s mysql_query_rules). ProxySQL will store results of queries for that time period. If it later receives the same query, it can quickly return those cached results instead of retrieving them from the database (which can be time intensive).
Monitoring metrics related to your query cache can help you verify that it is optimizing performance and that ProxySQL is running as expected. Datadog’s ProxySQL integration provides you with the resource and performance metrics you need to ensure the query cache works efficiently.
Correlate cache reads and writes
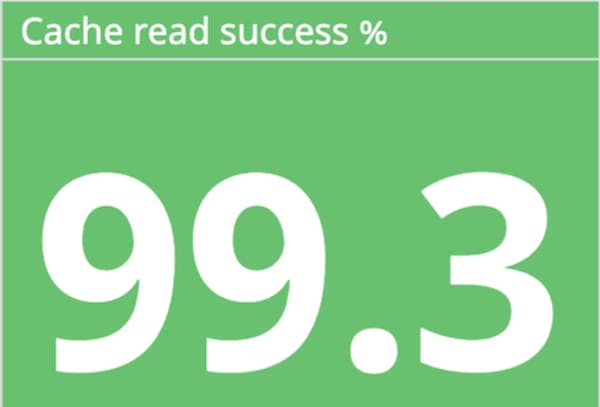
For any cache, you’ll want to verify that reads from it and writes to it are successful. With Datadog, you can monitor your cache read success rate by graphing the count of cache reads that were successful (proxsql.query_cache.get_ok.count) divided by the total amount of cache reads (proxysql.query_cache.get.count).
You can also correlate incoming writes (proxysql.query_cache.set.count) with the number of entries currently stored in the cache (proxysql.query_cache.entries) to see how effectively data is being written/updated to your cache. If you see a discrepancy (e.g., few entries in your query cache despite a high number of writes), it means data is not being properly written to your query cache and could mean your ProxySQL instances are misconfigured, or indicate a larger problem that needs your attention.
Ensure loads are balanced correctly
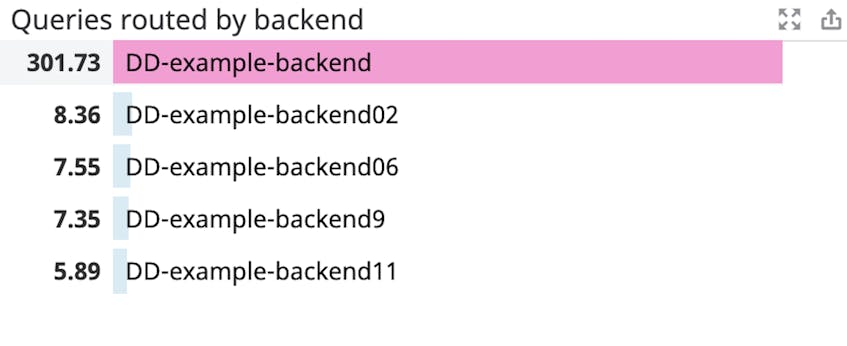
Monitoring ProxySQL is important because, as load balancer, it is meant to evenly distribute workloads among backend servers. If a subset of your backend servers become overwhelmed with a higher volume of requests, they can become unstable and fail, which can lead to higher application latency or even downtime. You can use the proxysql.pool.queries metric to track the number of queries routed toward each connected backend server (identified by the tags srv_host and srv_post). You can then use a toplist (shown in the image below) to see if any backends are overtaxed, letting you know when to reconfigure query rules to better route traffic or whether to take other steps to troubleshoot.
Verify ProxySQL is connected to clients and servers
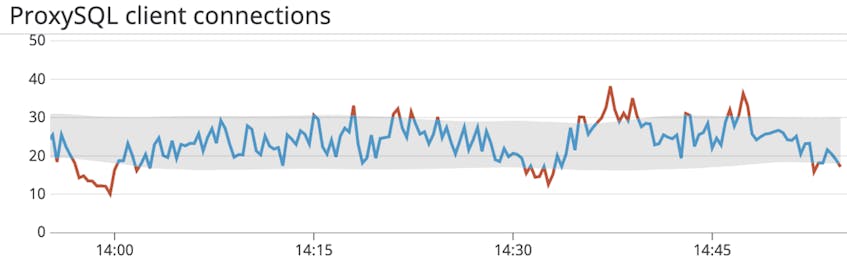
Because ProxySQL is a gateway between MySQL/MariaDB servers and clients, you will want to make sure it maintains its connections to both. Once you’ve enabled the ProxySQL integration, the Datadog Agent will start collecting both client and server connection metrics like the number of connection creations and failures per second so you can ensure ProxySQL has healthy connections and performs as expected. You can use anomaly detection to alert you to any unexpected drops or spikes in either aborted client or server connections so you can start troubleshooting immediately.
Monitor the rate of slow queries
One critical metric to pay close attention to as you monitor ProxySQL is its rate of slow queries (proxysql.slow_queries) per second. Slow queries (i.e., a query that takes longer than the ProxySQL global variable mysql-long_query_time to execute) can negatively affect the performance of your database and lead to excessive resource usage because ProxySQL needs more CPU and memory to execute them. You can graph the rate of slow queries in your dashboard and set up an alert to notify you if it exceeds a given threshold. If you are notified of a high rate of slow queries you can investigate, for example, by collecting slow query logs from your MySQL backend to see which queries you need to optimize.
Start monitoring ProxySQL with Datadog
Datadog’s new integration means you can easily monitor the health and performance of your ProxySQL load balancers and ensure that queries to your backend databases are being served efficiently. In addition to the 750+ technologies integrated with Datadog, you can monitor ProxySQL alongside your backend database, whether you’re using MySQL or MariaDB, ClickHouse DB, or Amazon RDS.
If you’d like to start using Datadog, you can sign up today for a 14-day free trial.
