

Netlify is a Jamstack web development platform that lets customers build and deploy dynamic, highly performant web apps. By uniting popular JavaScript frameworks, developer tools, and APIs into streamlined workflows, Netlify helps teams rapidly spin up and ship common Jamstack use cases, including e-commerce stores, SaaS applications, and corporate sites. Netlify supports these deployments with an integrated CI/CD tool, global multi-cloud edge network, and serverless backend.
You can now use Datadog to capture your Netlify web traffic and serverless function logs for long-term retention and analysis. In this post, we’ll look at how ingesting your Netlify logs into Datadog helps you monitor and visualize key web traffic and function performance data. We’ll also cover how Datadog Synthetic Monitoring can give you comprehensive visibility into the health and performance of your Netlify sites.
Send your Netlify logs to Datadog
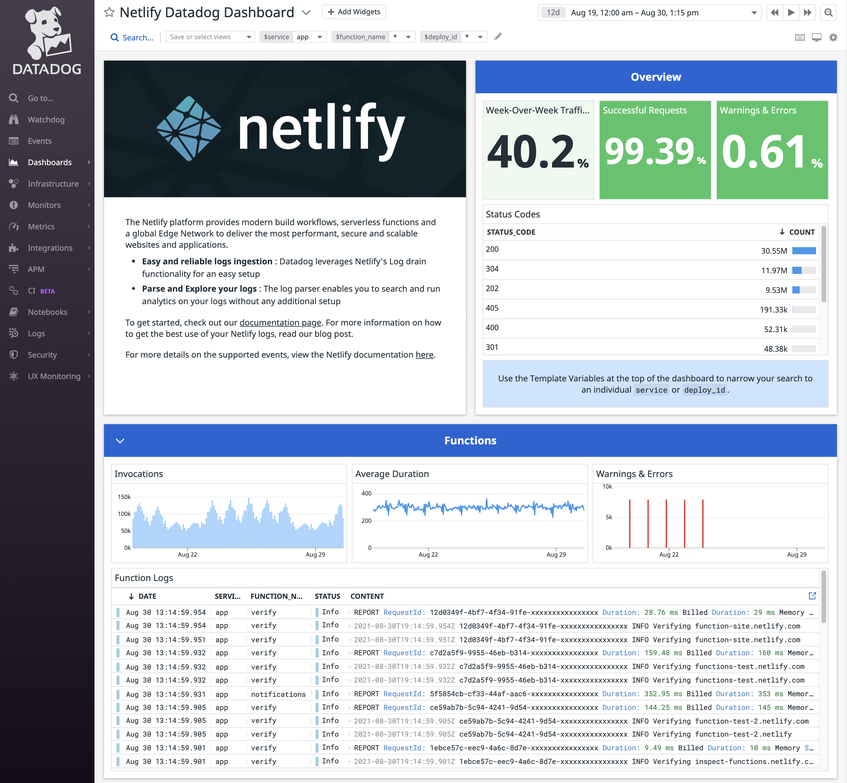
To send your logs to Datadog, you can use Netlify’s Log Drains feature, which allows Netlify users to forward logs to third-party monitoring services. Forwarding your Netlify logs to Datadog enables you to retain them beyond the 24-hour window of the Netlify console. Once you set up the integration, your logs will begin streaming into Datadog. Datadog’s built-in log processing pipeline automatically parses out key attributes from your logs, which you can then use to search, filter, analyze, and generate metrics. Datadog uses your parsed log data to populate an out-of-the-box Netlify dashboard that visualizes key telemetry from your environment, giving you a high-level overview of your Netlify apps.
Next, we’ll discuss how you can use your Netlify logs to get insights into:
Capture and analyze serverless function logs
Netlify Functions can be written in JavaScript, TypeScript, or Go and let you add dynamic backend processes to your websites without managing additional infrastructure. Netlify function logs contain key fields including function_name, timestamp, and status. Once your logs are streaming into Datadog, you can utilize these attributes in the Log Explorer to filter and sort your logs to surface error-prone or slow functions.

You can generate metrics from your logs to visualize and alert on things like 4xx/5xx error rates, latency, and request volume. For example, if you’re monitoring an ecommerce payment function, you might want to set an alert on its error rate. This way, you can be notified of issues before they might lead to lost revenue and potential customer churn.
You can also use your serverless logs to collect key business insights by adding custom information to the log_message field at runtime. For example, if you’re monitoring an ecommerce payment function, you can log the dollar value of the transaction, the customer ID, and any relevant product IDs. You can then visualize that information in Datadog to build context for your business analytics.
Use traffic logs to understand user behavior
Your Netlify application’s web traffic logs are emitted directly from its CDN’s Edge Network. Traffic logs can provide visibility into your site’s overall performance. Using key attributes like duration and status_code, you can generate the standard RED (requests, errors, and duration) metrics for your site and break down errors by status code. Creating alerts for these metrics and visualizing them in your dashboards helps you validate the health and performance of your site in real time and stay ahead of user-facing problems.

Netlify traffic logs can also help you analyze your users’ traffic patterns to identify trends and spot anomalous behavior—such as a DDoS attack. For example, you could use the status_code attribute to create a log-based metric counting 504 errors, and then alert on a critical threshold. If the alert triggers you can use the Log Explorer to investigate the relevant logs to determine if they appear to be from a fraudulent source by filtering the logs by the relevant URL path then drilling into log events in the resulting list to see, for example, if a majority of requests are coming from a small group of IPs in a strange location.
Monitor your frontend performance with Datadog Synthetic Monitoring
In addition to logs, digital experience monitoring can provide a deeper view into how your webpages respond to traffic and whether they are working correctly for users. With Datadog Synthetic Monitoring, you can create multistep browser tests that enable you to view the response times of individual content fetches during a page load, alongside the performance of dynamic DOM content. By setting up browser tests for your Netlify application, you can measure the performance of key user flows and quickly spot errors and speed bottlenecks. Each step includes a detailed waterfall timeline of all the static content fetches, client-side JavaScript, and API calls required in a page load, alongside Core Web Vitals—such as Largest Contentful Paint and Cumulative Layout Shift—that help you characterize the user experience.

By adding HTTP request steps to your browser tests, you include calls to your Netlify Serverless Functions in your user flows to create a holistic picture of your site’s performance from both frontend and backend data. For example, you could create a checkout flow that includes a call to your payment function via the relevant API endpoint. You can see detailed information about the request, including the overall duration, status code, and request size, along with a waterfall showing a breakdown of the DNS request, SSL handshake, time to first byte, and download, to understand how these processes contribute to the overall latency.

Get started with Datadog and Netlify
With Datadog and Netlify Log Drains, you can easily ingest Netlify logs for full visibility into your serverless functions and site traffic. And, by using Datadog Synthetic Monitoring to track frontend performance, you get a comprehensive solution for monitoring your Netlify-powered applications. Log Drains is available now with Netlify’s Enterprise plan. For more information about the integration, see the Netlify Log Drains documentation and our own integration docs. Or if you’re brand new to Datadog, sign up for a free trial to get started.
