Jordan Obey

Angelina Jin
NetFlow is a network protocol that enables devices to report key traffic flow data such as origin, direction, and overall volume. Whereas SNMP—another protocol used for network monitoring—surfaces a wider range of network-device telemetry such as CPU, memory utilization, and the temperature of devices, NetFlow telemetry allows network administrators to gain a deeper understanding of traffic flows utilizing bandwidth and to identify bottlenecks which can lead to degraded performance and hinder end-user experience.
Today we’re pleased to announce that NetFlow monitoring is now available through our Network Device Monitoring (NDM) view, providing you with visibility into your devices’ NetFlow data—along with other Netflow variants such as IPFIX, sFlow, and JFlow—directly within the Datadog platform. With NetFlow Monitoring, you can now identify the top contributors to your network traffic (i.e. top talkers, top listeners), investigate if network resources are properly utilized so your network team knows when to upgrade circuits for capacity planning, and what top applications are using the available bandwidth.
In this post, we’ll look at how you can use Datadog NetFlow monitoring to visualize NetFlow telemetry and identify which devices and applications are behind the largest volumes of traffic so you can mitigate bandwidth congestion and optimize your network.
View in-depth NetFlow traffic
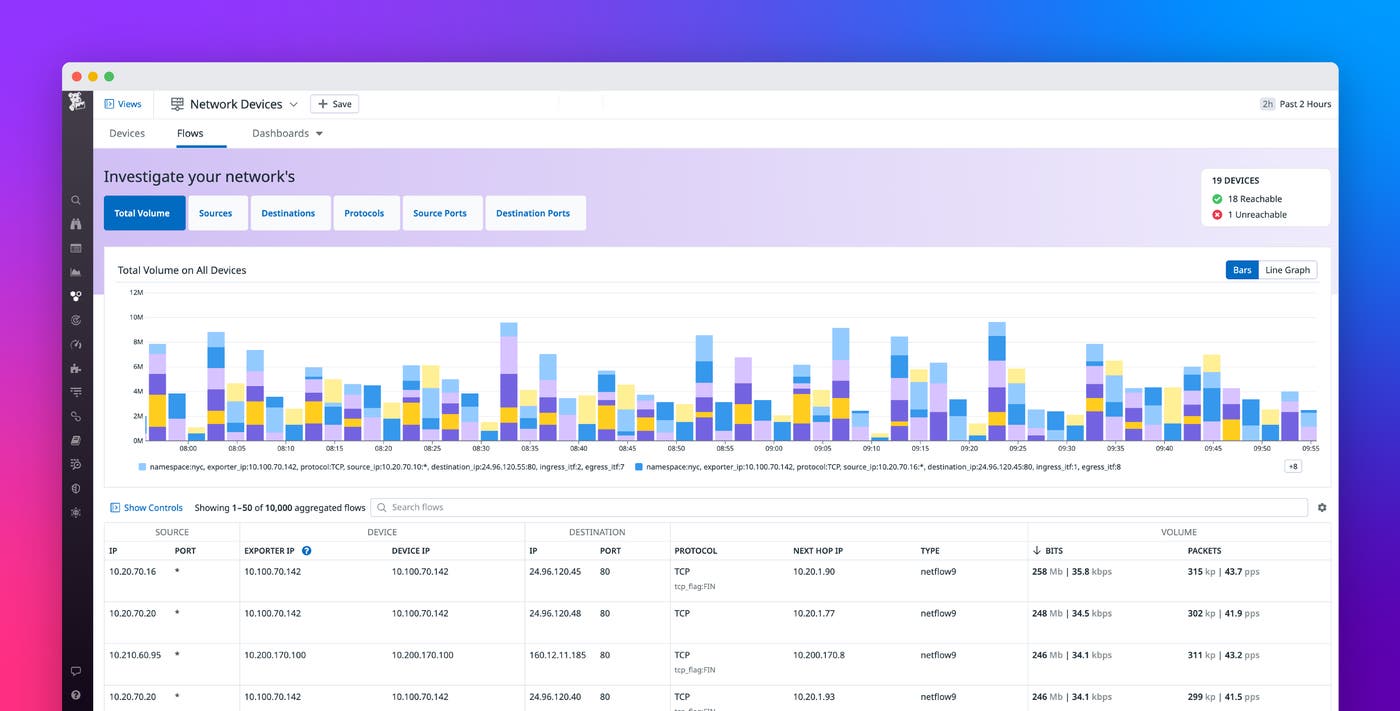
After you configure your NetFlow-enabled devices to report telemetry to Datadog, critical flow records will immediately be visualized on a single pane of glass within the Flows view. Incoming NetFlow data contains the IP address, model, and vendor of your network devices, and is enriched with crucial identifying markers such as the application names (i.e. Postgres, Redis) for source/destination ports and the cloud provider, service, region (i.e. AWS, EC2, us-west-1) for source/destination IPs, making it easy for administrators to perform network investigations. This means that if your on-prem network consists of switches, routers, and firewalls from various vendors, you can filter the view to only show traffic from specific interfaces or applications to focus your investigation.
In addition to querying traffic data from within the Flows view, Datadog also enables you to get a complete overview of network device traffic through our customizable, out-of-the-box NetFlow monitoring dashboard.
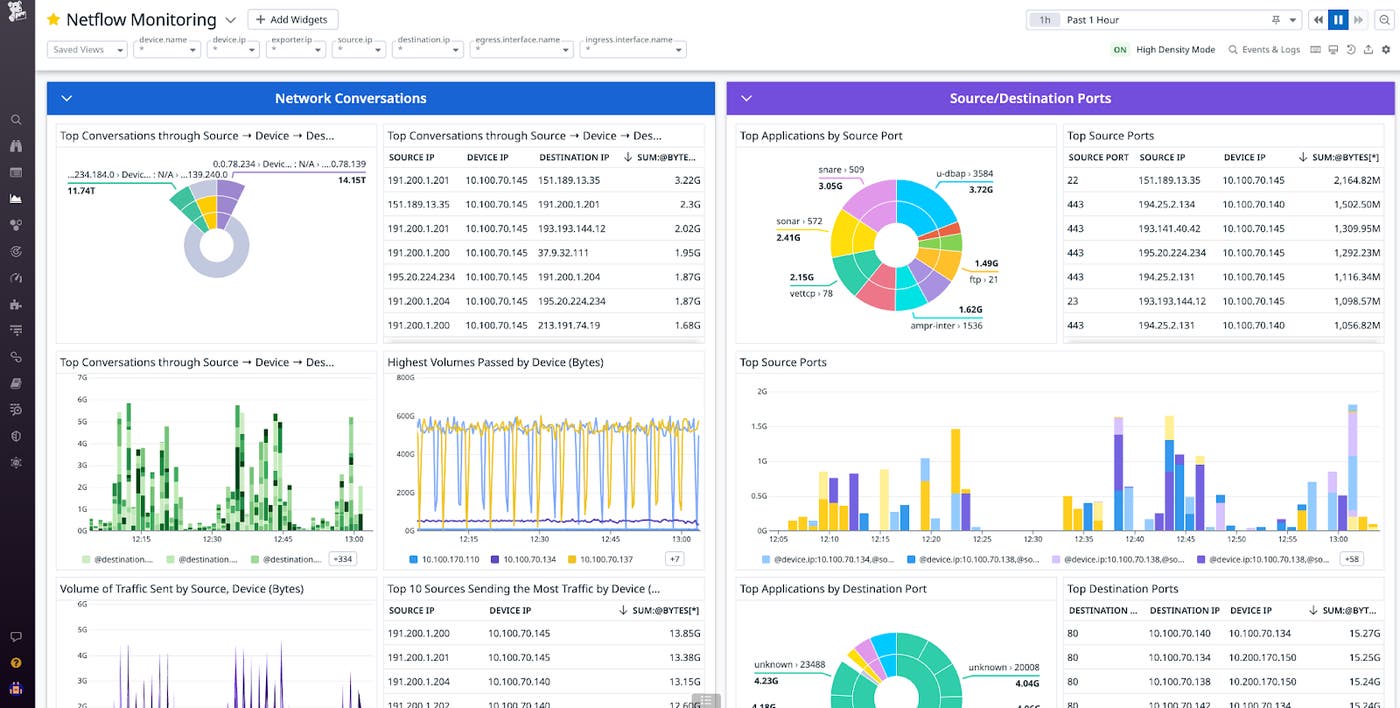
This dashboard visualizes critical NetFlow data, such as which NetFlow-enabled devices and applications within your network are sending and receiving the most traffic, so you can quickly understand the state of your network and identify any issues. For example, you can filter for a particular interface and deep dive into the traffic to understand which IPs are the top-talkers over that interface.
Monitor Netflow data to aid network planning and mitigation
Organizations rely on network health to ensure their day-to-day operations run smoothly. That’s why implementing a strong network infrastructure design is critical to their success. Over-congested or misconfigured devices can result in high latency and degrading network performance that severely impairs your ability to serve customers.
Visibility into NetFlow data can help you confirm that your network is performing as designed and meeting requirements. If, for instance, you are notified that Zoom calls in your office are dropping and experiencing heightened lag times, you can investigate NetFlow traffic to identify bottlenecks or other issues that may be negatively impacting your network. Perhaps your company has recently undergone a significant increase in headcount, and through your investigation you discover that your network devices are receiving higher traffic than usual. In this case your devices may no longer have the bandwidth to accommodate your needs which could be causing the degraded Zoom performance. With NetFlow Monitoring, you are able to understand what part of your network traffic comes from known applications. You can also detect any unexpected applications or IPs saturating your bandwidth and consuming excessive resources which hinders Zoom’s ability to run smoothly.
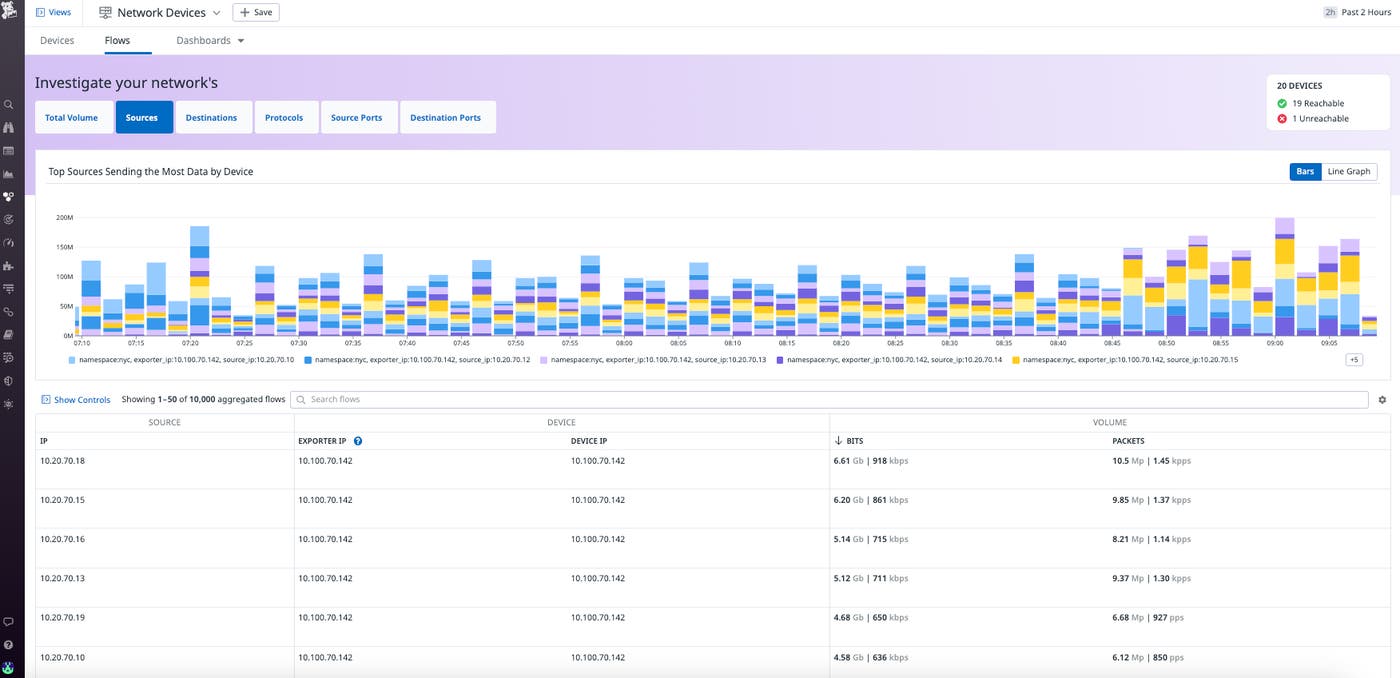
Once you’ve identified the congestion, you can take steps to resolve the issue such as upgrading your devices and reconfiguring your network so that business critical applications like Zoom are prioritized and always have enough bandwidth.
Start monitoring NetFlow traffic today
With NetFlow monitoring support from NDM, you can gain full visibility into the flow records of your network devices to quickly identify and resolve bottlenecks. You can monitor NetFlow records alongside SNMP Trap data and other network telemetry collected by Datadog to diagnose network health issues and immediately begin troubleshooting. To learn more about NetFlow monitoring, please read our documentation.
If you aren’t already using Datadog, sign up today for a 14-day free trial.
