Jordan Obey
Hyper-V is a hardware virtualization platform used to create and run virtual machines on Windows host systems. Hyper-V allocates resources from the physical hosts it runs on to the virtual machines it creates. If those resources are spread too thin, virtual machines may encounter slow performance and startup failures. With our new integration you can monitor the health of every layer of your Hyper-V stack: physical hosts, virtual machines, and all of the applications and services running on them.
Get alerted when host memory is too low
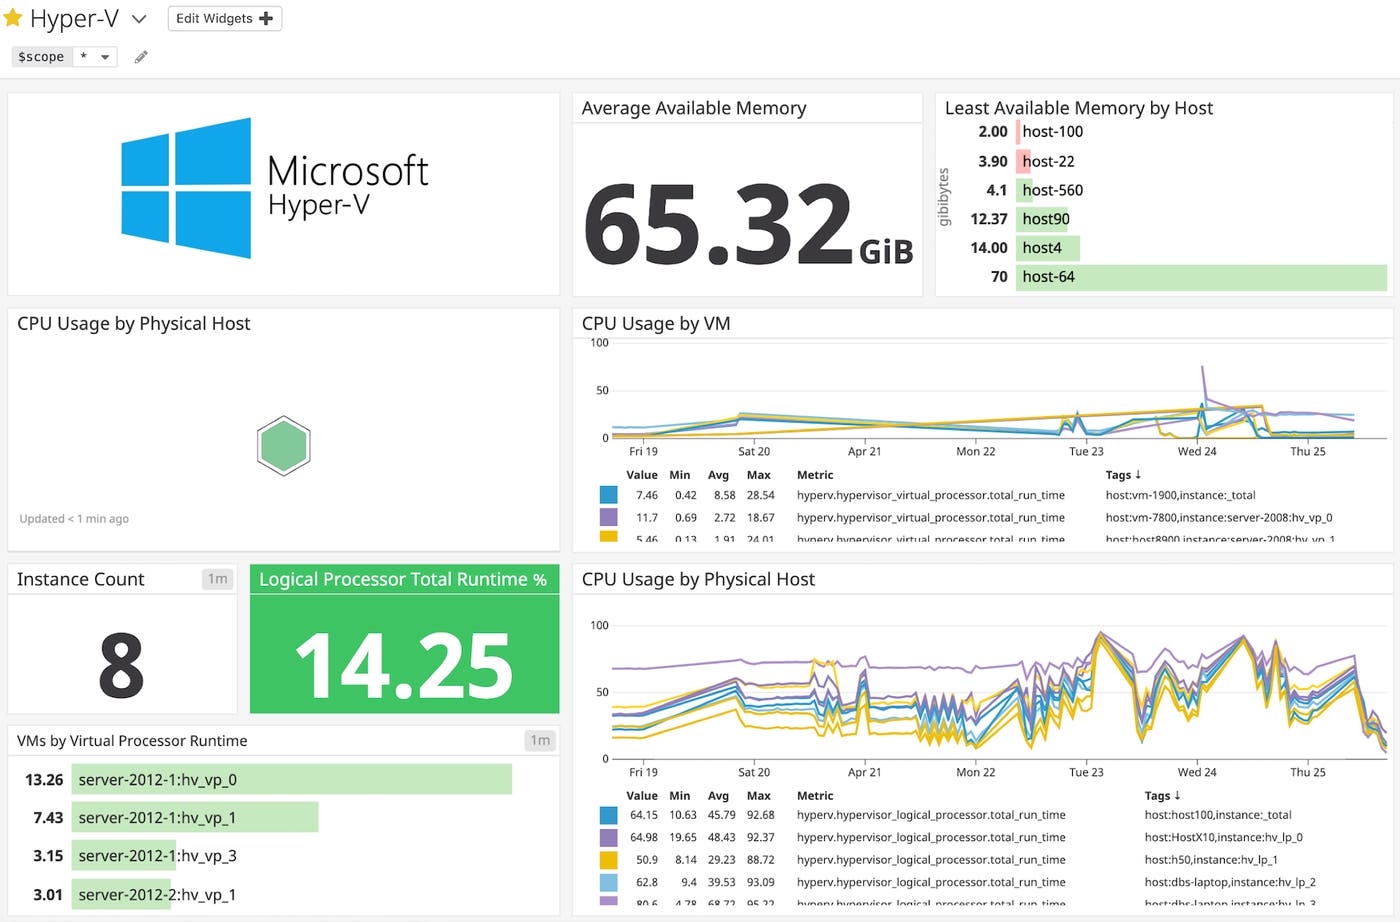
While memory needs vary by use case, the Hyper-V documentation recommends running only three to four VMs on a physical host that has 4 GB of available memory. You can allocate host memory either statically (which configures a pre-set memory limit for each VM) or dynamically (which adjusts memory allocation based on virtual machine workload). Regardless of which approach you’re using, you’ll want to monitor the available memory on your hosts to ensure that new and existing virtual machines have sufficient resources.
With our integration, you can set up an alert to get notified when a Hyper-V host’s available memory drops below a set threshold. This way, you can avoid excessive paging and prevent performance impairment by stopping the non-essential services on memory-intensive virtual machines or moving them to other hosts.
Monitor CPU workloads across physical and virtual machines
In Hyper-V, logical processors correspond to the number of threads that can run on your hosts, while virtual processors represent the portion of these logical processors that can be allocated to virtual machines. Datadog provides deep visibility into the workloads running on both types of processors, so you can get a complete picture of your system. In Datadog, Hyper-V metrics are tagged by host and/or instance, which correspond to the name of a physical host or virtual machine.
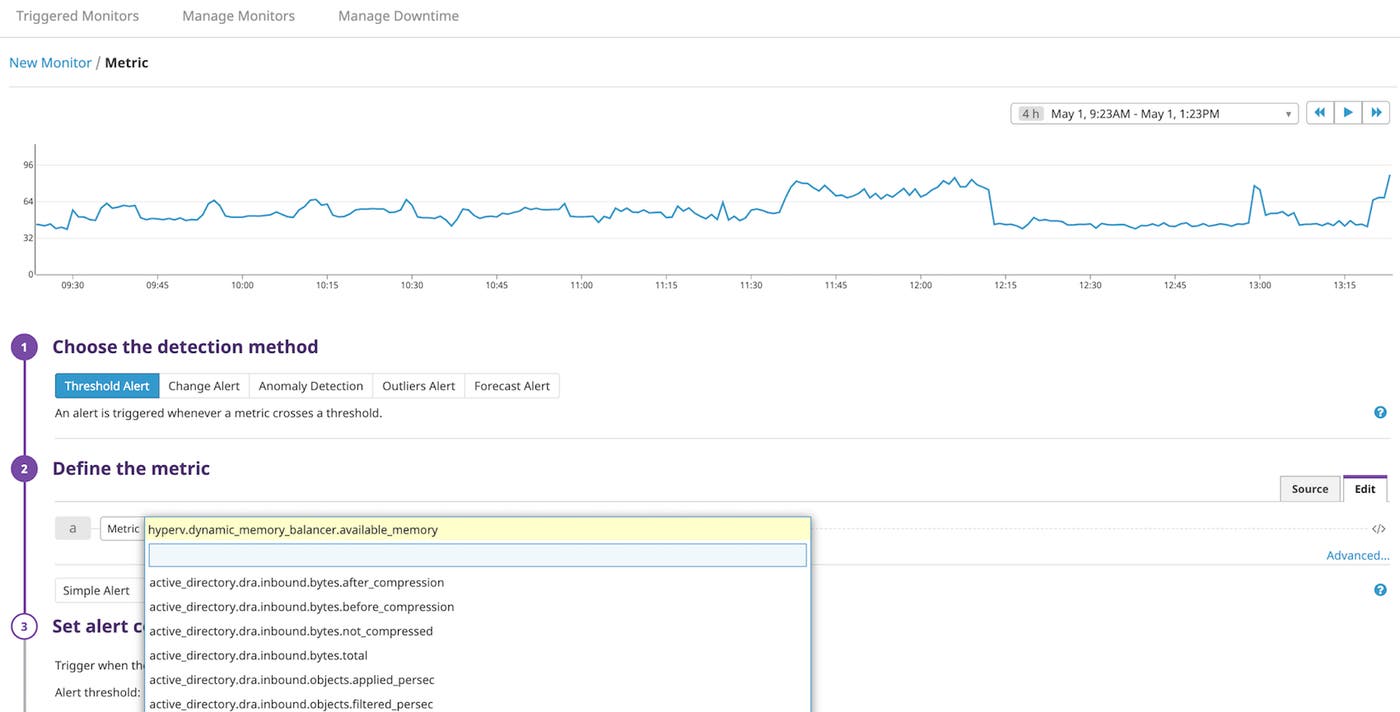
If a host’s logical processor utilization is over 90 percent, that host is overloaded, which means that you should either migrate to a host with more compute capacity or reduce the number of virtual machines it is running.
To anticipate such a case, you can graph real-time CPU usage across your Hyper-V infrastructure, broken down by physical host, to monitor how it changes over time. In the example below, we have added a marker to help annotate the 90 percent limit. In addition to graphing CPU usage, you can also set up an alert to notify you if a host is overloaded.
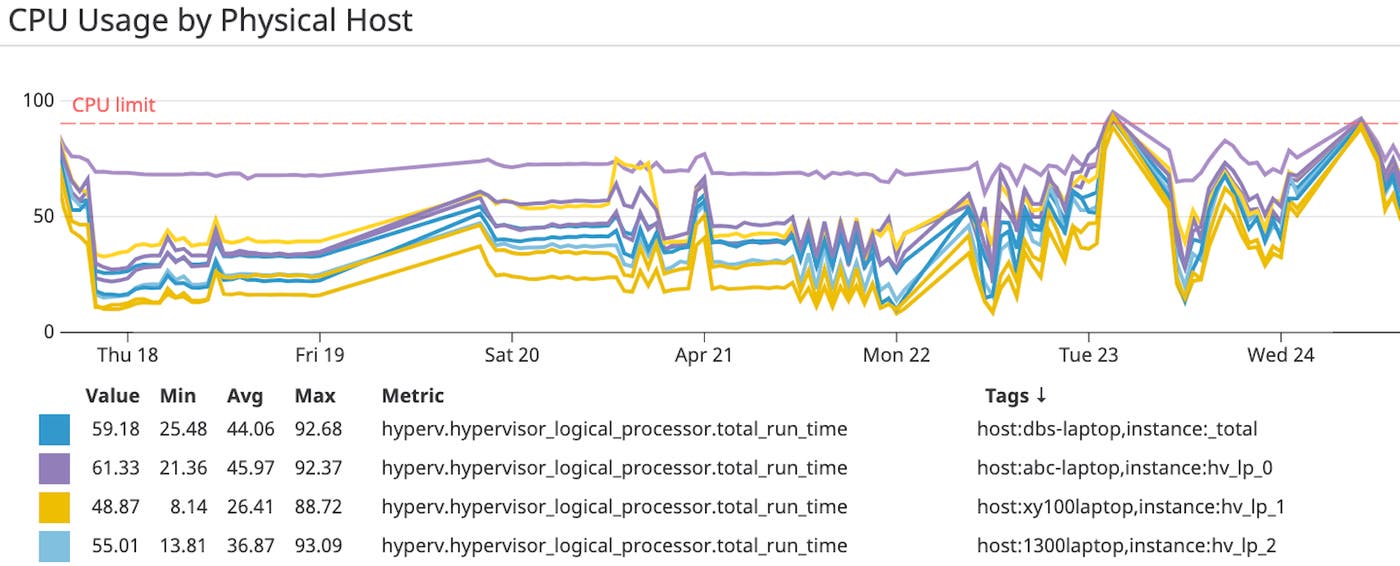
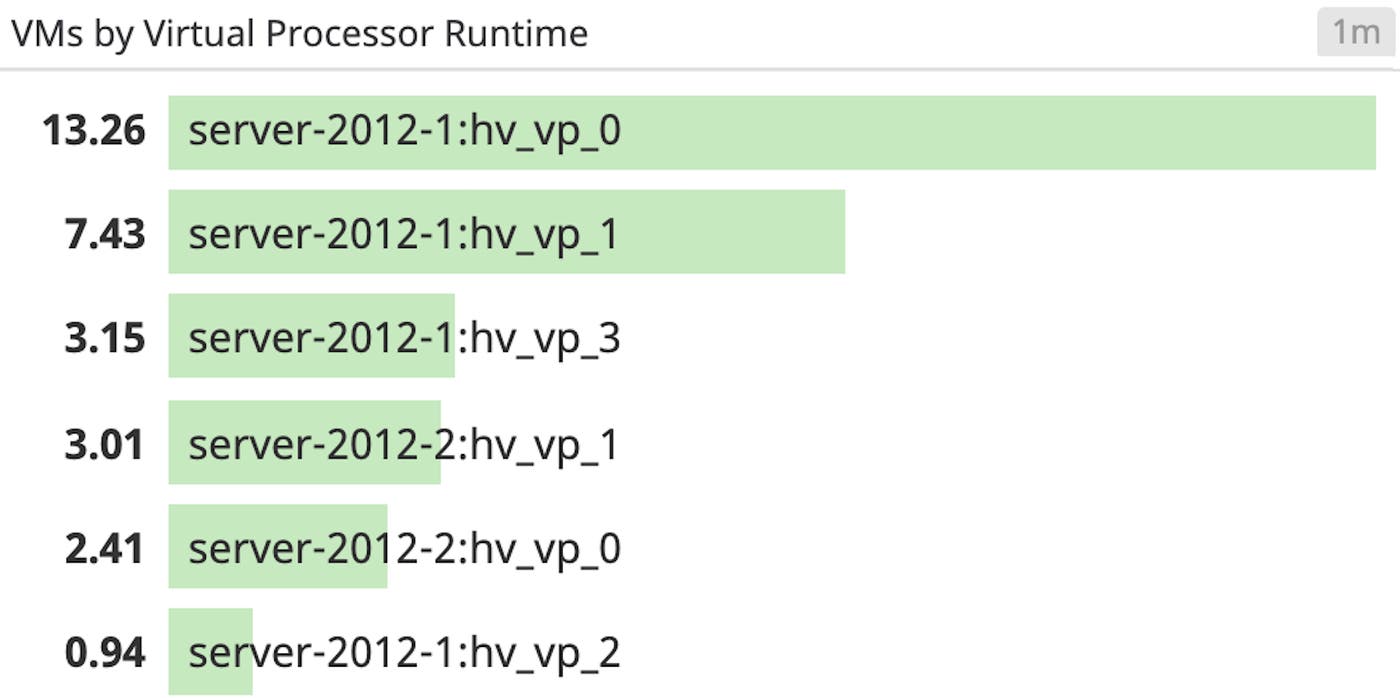
If you want to inspect a resource-intensive host in more detail, you can use the out-of-the-box dashboard’s $scope template variable to filter by that host—simply select the host:<HOST_NAME> tag in the dropdown menu. The top list will update to display that host’s virtual machines, ranked by virtual processor runtime. This way, you can quickly identify the virtual machines with the greatest workloads that may be causing slower performance, and act to reduce their CPU usage.
Get real-time insights with Windows Live Process monitoring
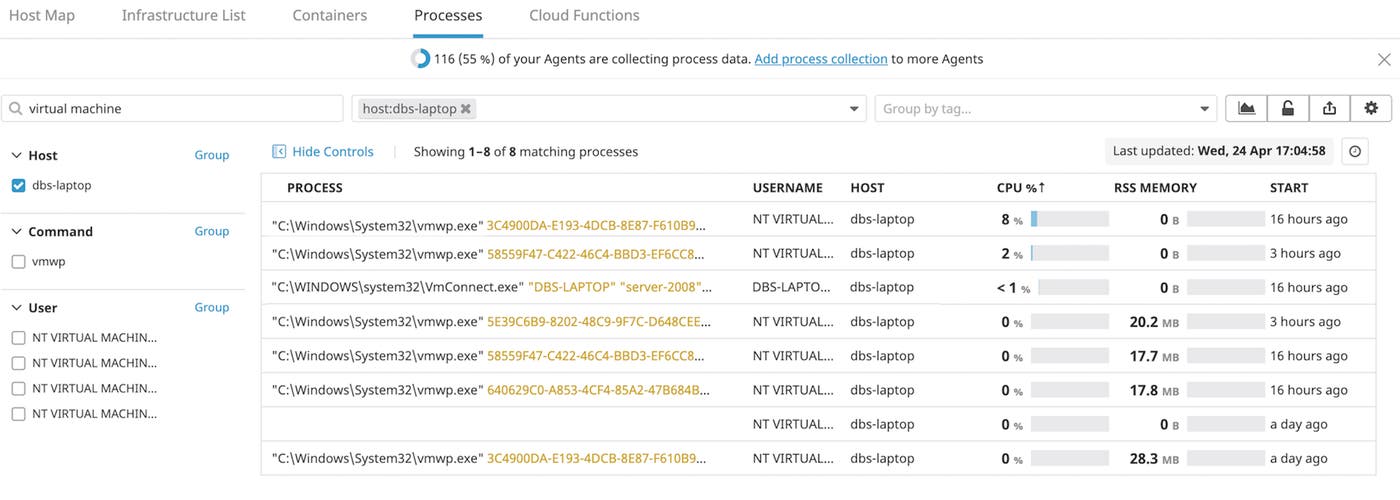
Virtual machines in Hyper-V run on hosts as Virtual Machine Worker Processes (VMWP). Datadog’s Live Process monitoring provides a granular view of process-level resource usage across each of your Hyper-V virtual machines, updated every two seconds. By using tags, you can filter to narrow your focus to processes running on a particular Hyper-V host. In addition to real-time process-level system metrics, you can reference historical process data going back 48 hours for further context.
Monitor Hyper-V alongside the rest of your Windows stack
Hyper-V is part of a growing list of Datadog’s 1,000+ integrations, including Microsoft Azure, IIS, and SQL Server. Datadog enables you to monitor the resource usage of Hyper-V hosts and virtual machines with real-time alerting and visualization. If you aren’t already using Datadog, get started with a 14-day free trial.


