Paul Gottschling
MarkLogic is a multi-model NoSQL database with support for queries across XML and JSON documents (including geospatial data), binary data, and semantic triples—as well as full-text searches—plus a variety of interfaces and storage layers. Customers include large organizations like Airbus, the BBC, and the U.S. Department of Defense.
Because MarkLogic can process terabytes of data across hundreds of clustered nodes, maintaining a deployment is a complex business. Datadog’s integration for MarkLogic gives you the visibility you need to identify performance issues and tune your deployments more effectively.
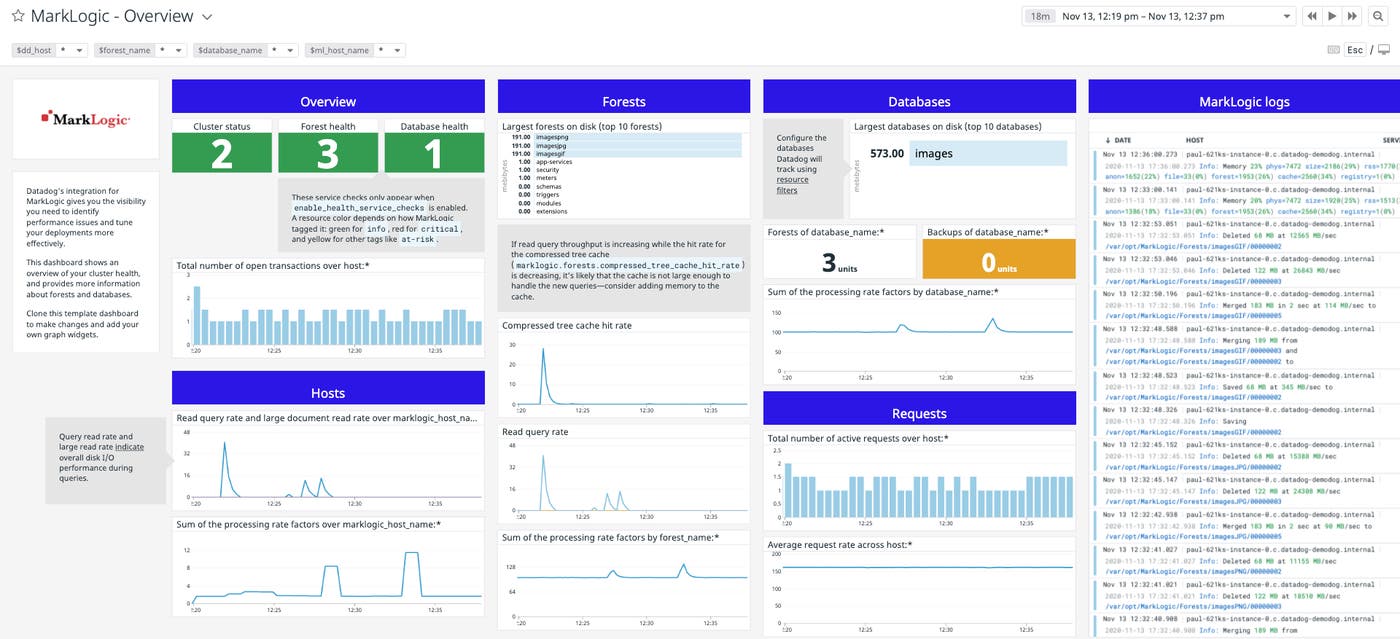
As soon as you enable the integration, you can use an out-of-the-box dashboard to start monitoring MarkLogic right away.
Monitor your storage performance
MarkLogic is designed to process massive amounts of data, but misconfigured clusters can bog down performance. Datadog’s MarkLogic integration helps you ensure that data travels from your storage layer to clients as quickly as possible.
MarkLogic stores data in forests, groups of XML, JSON, text, or binary documents associated with a particular file system. Administrators attach forests to a single database, which carries out read and write operations against the forests while executing queries. Forest-backed data is compressed and stored in fragments. MarkLogic servers responsible for managing forests, called Data Nodes, send these fragments over the network to specialized servers, called Evaluator Nodes, that expand the fragments in order to serve queries. Data Nodes store fragments in the compressed tree cache, which prevents them from having to read data directly from disk (this is slower and has the potential for lock contention if a document is being updated).
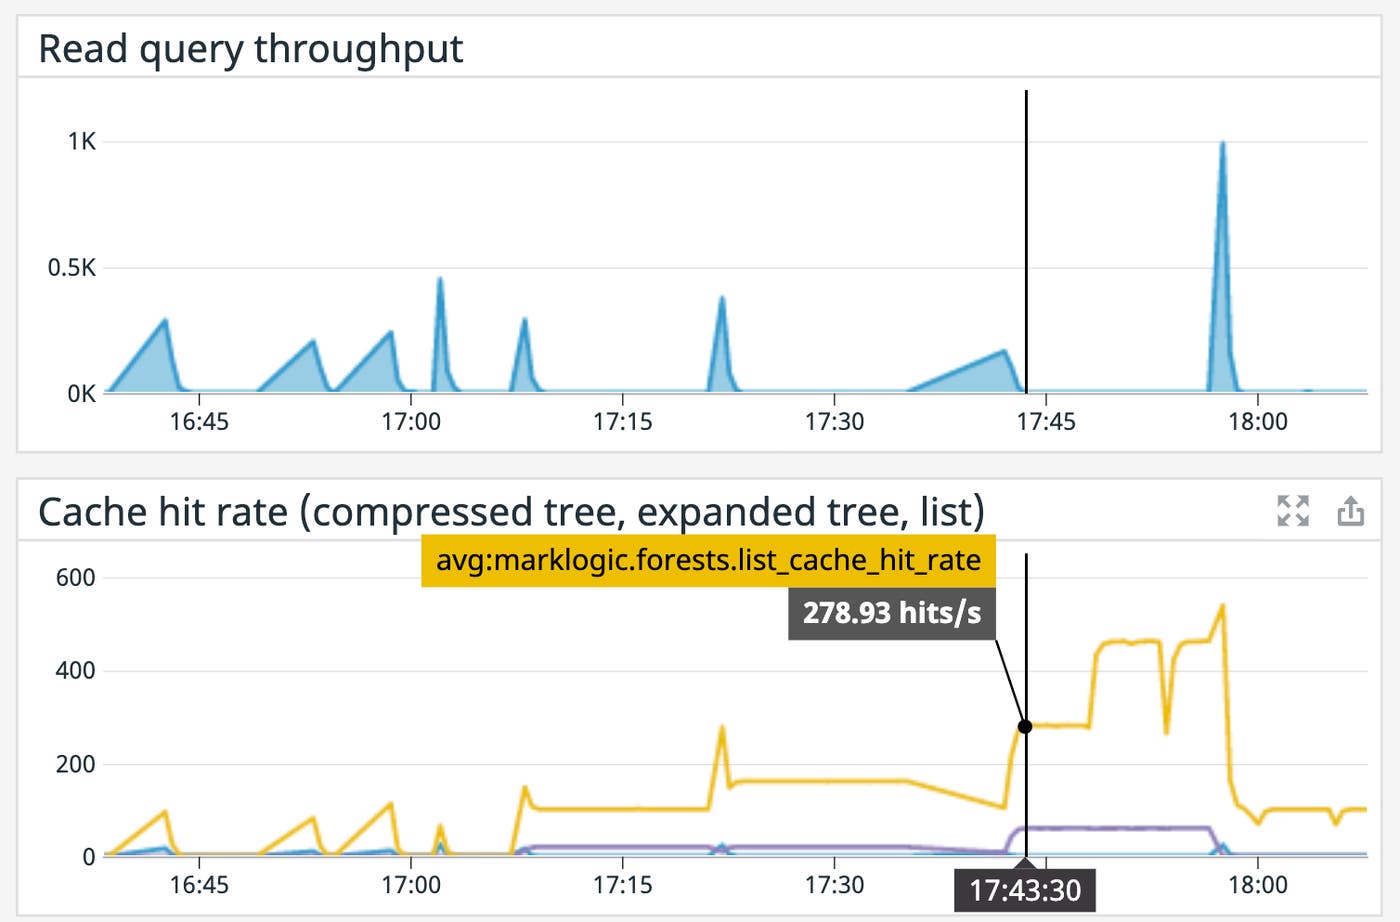
You can track read query throughput by summing the metrics marklogic.hosts.query_read_rate and marklogic.hosts.large_read_rate. (Read metrics for other operations, such as backups and merges, are also available; see our documentation for details.) If read query throughput is increasing while the hit rate for the compressed tree cache (marklogic.forests.compressed_tree_cache_hit_rate) is decreasing, it’s likely that the cache is not large enough to handle the new queries—consider adding memory to the cache. Datadog also tracks hit rates for other MarkLogic caches, such as the list cache and expanded tree cache, so you can tune your queries more effectively.
Understand network activity
MarkLogic nodes need to communicate with clients and other nodes within a distributed cluster. Datadog can help you detect traffic spikes and connection failures in your MarkLogic deployment.
MarkLogic nodes communicate via the XML Data Query Protocol (XDQP), and use a heartbeat to evict unresponsive nodes from the cluster. If some nodes get evicted, the remaining healthy nodes could become overloaded with query traffic, causing a cascading failure. You can track XDQP throughput using metrics following the pattern marklogic.hosts.xdqp_(client|server)_(send|receive)_rate. Group this metric by the marklogic_host_name tag to see if spikes or losses in traffic are particularly acute for certain hosts. If a spike in XDQP throughput correlates with CPU saturation across your nodes—or begins to drop off—you can take steps to protect your cluster.
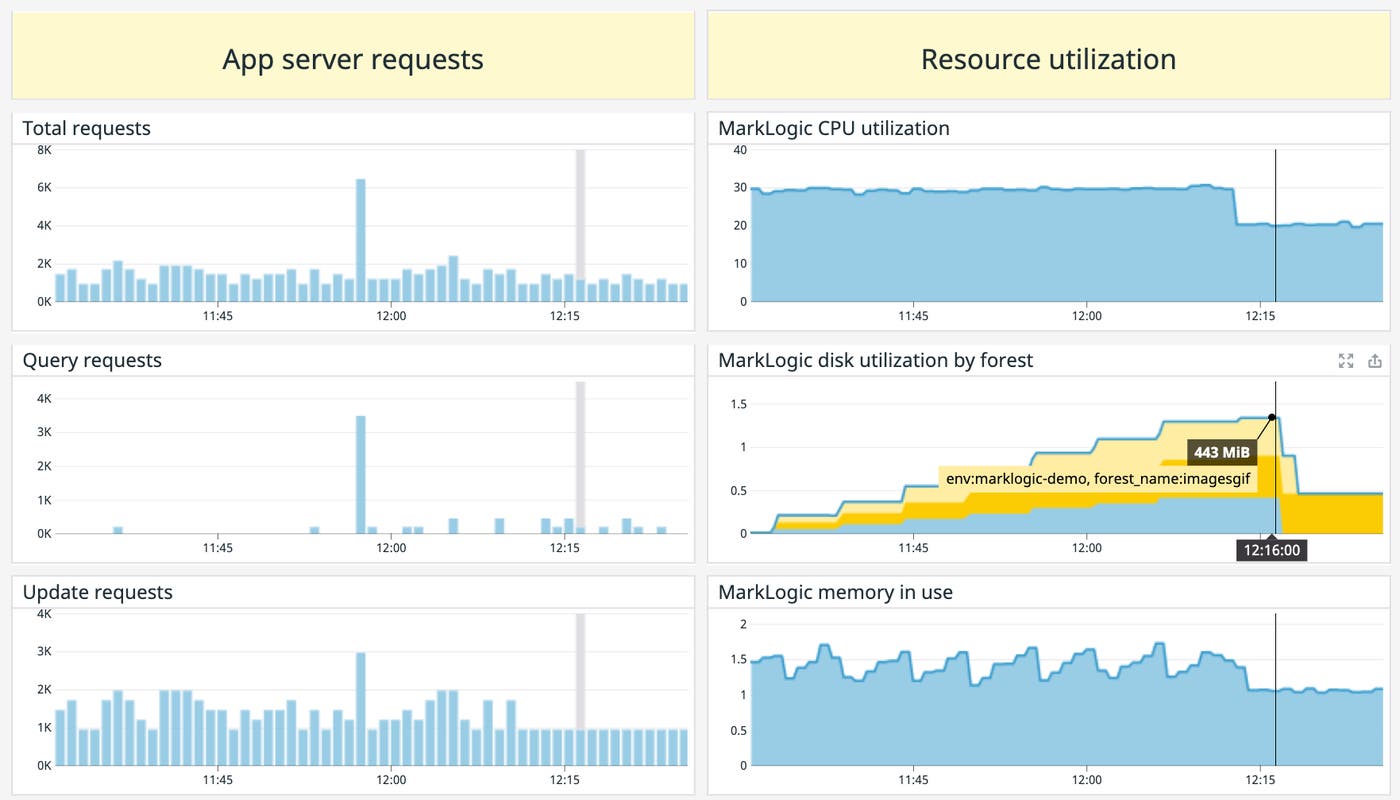
Client applications can query a MarkLogic database using HTTP, ODBC, XDBC, or WebDAV at endpoints called App Servers. Use marklogic.requests.total_requests to track active requests to MarkLogic App Servers, and filter this metric by the server_name tag to monitor demand on a specific server. (You can configure resource filters to enable tagging MarkLogic metrics by the names of specific forests, databases, hosts, and servers.) If you suspect that high request traffic is causing resource saturation issues in your MarkLogic cluster, consider setting limits on concurrent requests to your App Servers or adding more evaluator nodes.
Stay on top of errors
Datadog’s MarkLogic integration helps you quickly detect and analyze trends in error logs. A built-in log-processing pipeline automatically enriches your MarkLogic logs with facets, so you can group and filter error logs to identify trends. For example, you can group App Server error logs by URL path to see if a specific endpoint is behind the problem, or group by database operation to see if particular types of queries are causing internal error messages.
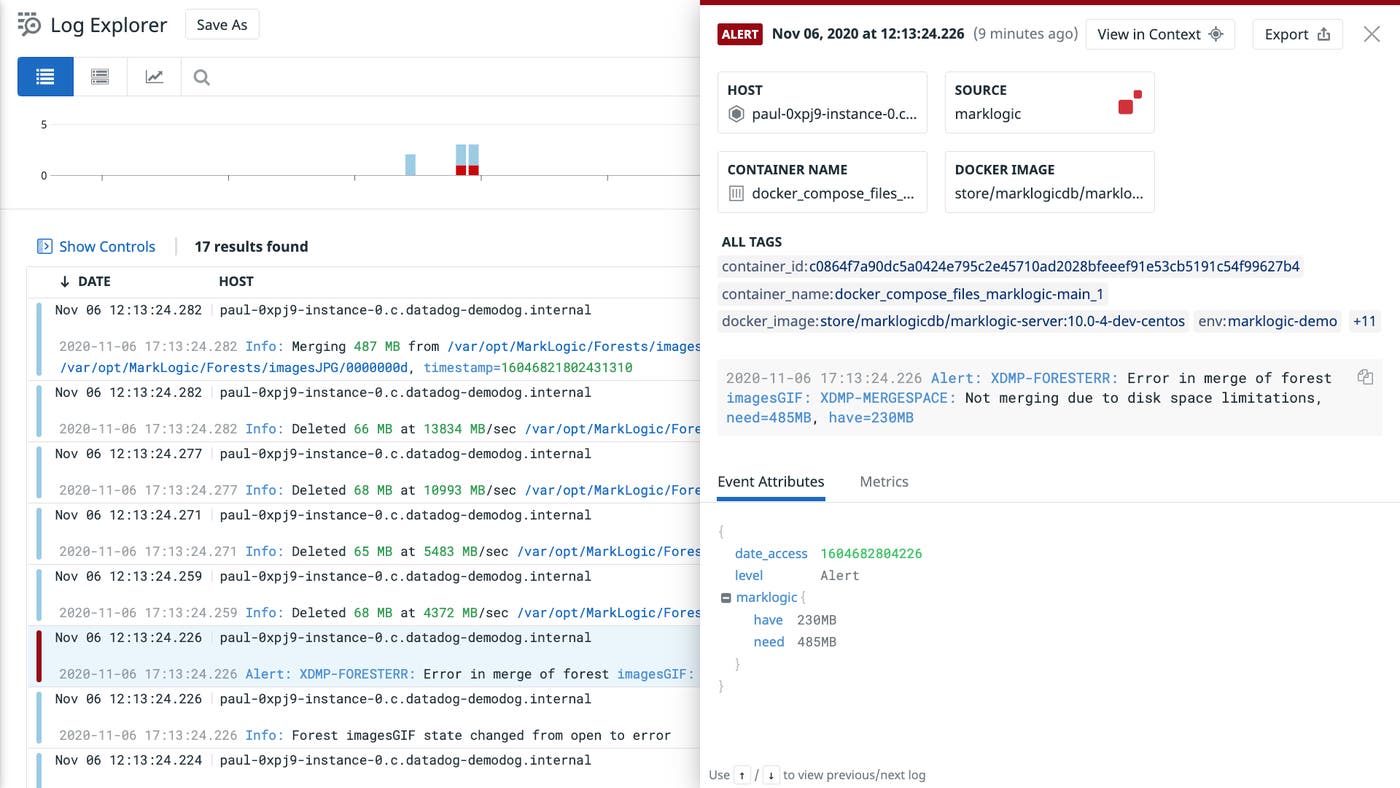
You’ll want to take action as soon as possible if MarkLogic is emitting error logs more frequently than usual—Datadog enables you to create alerts that will automatically notify your team when this occurs, so you can quickly start troubleshooting.
Unify your MarkLogic monitoring
With Datadog’s MarkLogic integration, you can optimize storage performance, detect connection failures, and debug database error messages. For even deeper visibility into your cluster, you can enable Datadog’s integrations for technologies in your storage layer, like Hadoop, Amazon S3, and Azure Blob Storage. Sign up for a free trial to get started.


