

This is a guest post by Leif Walsh @leifwalsh who is a Senior Software Engineer at Tokutek.
The database market is rapidly evolving in response to the explosion of big data applications. Many of those innovations are easy to see – a new class of NoSQL database products, for example – but some are “under the covers.” Fractal Tree indexing is one of those hidden innovations. Originally developed by data scientists at M.I.T., Rutgers, and Stony Brook, Fractal Tree indexing replaces 40-year-old B-tree indexing which simply wasn’t designed to handle the volume and velocity of data processing that is required for most big data applications. Fractal Tree indexes are at the core of the Tokutek database product family: TokuMX for MongoDB and TokuDB for MySQL and MariaDB.
TokuMX was designed to handle large volumes of unstructured data in what is commonly called a NoSQL database. Until now, the only way to see metrics related to performance was to collect it with custom-built scripts and manually feed it into other tools. It was possible to get some information with tools built to monitor MongoDB, however, those tools are not capable of reporting on the new features and capabilities Fractal Trees add to MongoDB, such as cache behavior, locking, and compression statistics, from the core storage engine.
As a result, TokuMX customers require a monitoring and performance analysis tool designed specifically for our database products. For that reason, we have developed a TokuMX integration with Datadog’s monitoring service. With this integration, we offer an enterprise-grade, first class, extensible monitoring, analysis, alerting, and reporting framework that gives you immediate, actionable insights into your TokuMX application’s performance.
Key TokuMX metrics to monitor
With Datadog we monitor the following key metrics. For each metric you will find a short summary of what it measures, how to query for it in Datadog, and an example to illustrate the metric.
Opcounters
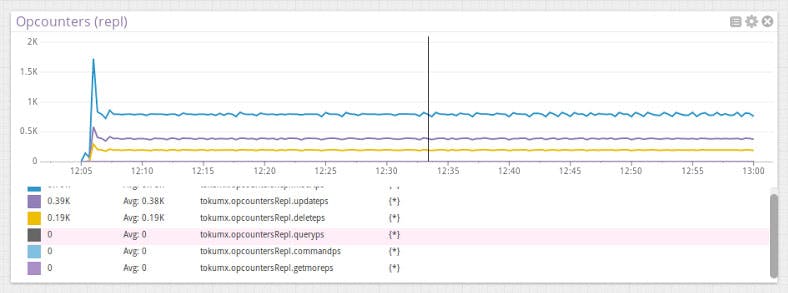
One of the most basic TokuMX metrics to monitor is opcounters. This metric is broken up into two charts. The first shows direct client inserts, updates, deletes, queries, getMores, and commands. The second shows the rate at which these operations are replayed on replication secondaries. These two graphs form a pretty good overview of cluster health.
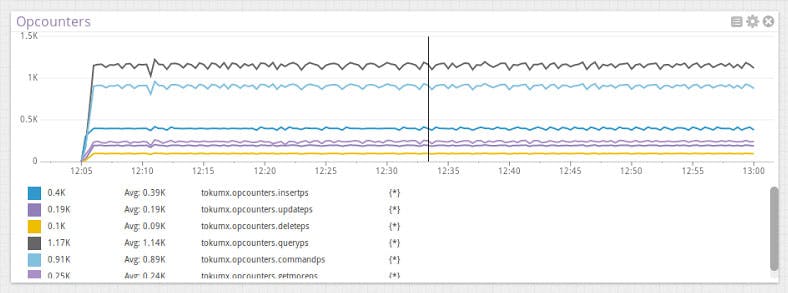
If you see dips or spikes in any of the tracked opcounters, it might indicate a problem with the servers, or it could also indicate increased traffic for which you might want to take action.
Replication lag
If you’re running TokuMX with replication (as you should), you’ll also want to keep an eye out for replication lag. It’s rare that secondaries can’t keep up because of some of TokuMX’s optimizations, but if they can’t, you’ll want to know immediately to avoid stale backups, fatal secondaries, and unnecessary risk.
Datadog tracks replication lag in seconds for each secondary, and shows a heatmap so you know the distribution of lag in your cluster at all times.
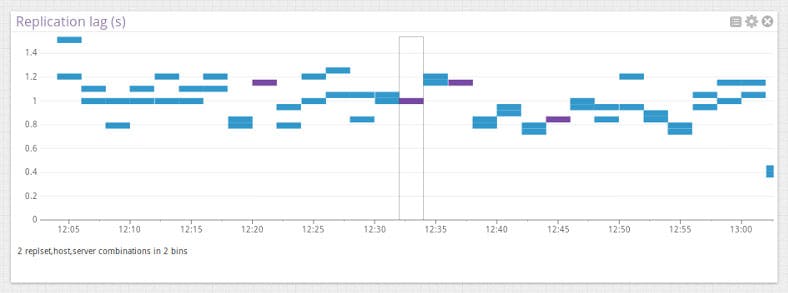
In this simple example, both secondaries are only lagging by about a second. However, if these numbers trend upward, you’ll need to track down the source of the lag.
Cache table utilization and storage size
Datadog also tracks the resident memory used by all TokuMX servers, as well as the amount of storage used by each individual collection.
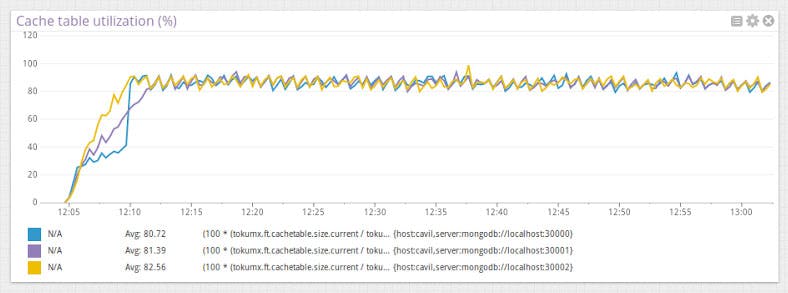
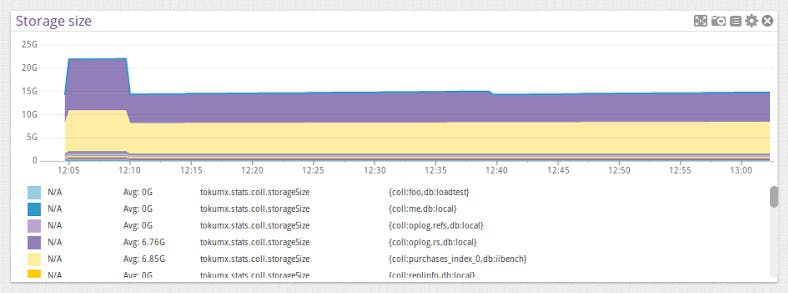
You can drill down to see the storage size used by individual databases or collections by filtering by tags. This is particularly helpful for different groups in your company who want to know just how their app is using resources. These aggregate and individual graphs are great in custom ScreenBoards you build, where you can monitor key characteristics across collections and visualize them in one place.
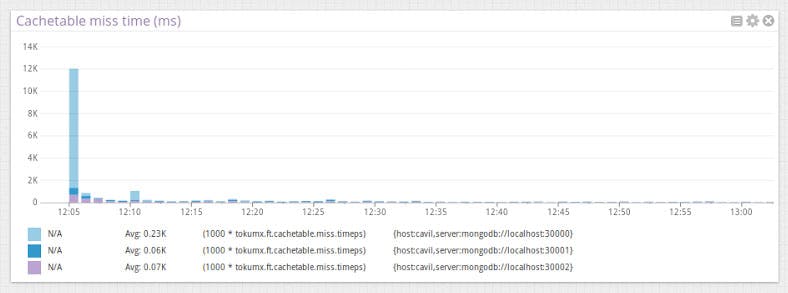
View cluster health with out-of-the-box dashboards
Out-of-the-box, the Datadog-TokuMX integration comes with a TokuMX dashboard, where key metrics are graphed for you. You can track the time spent in each checkpoint to make sure each one completes in a timely manner using the checkpoint duration graph.

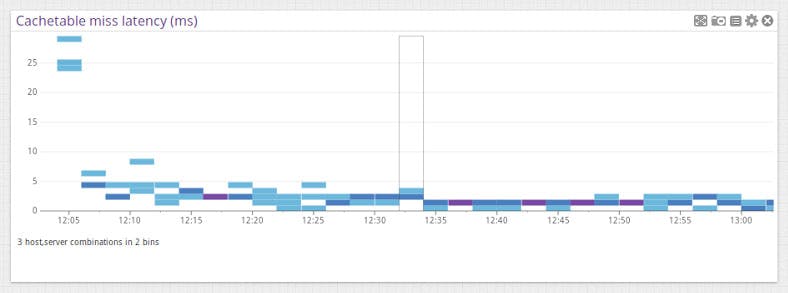
You can make tuning decisions and optimize your infrastructure with the following cache table miss time and latency graphs. Since all cache misses in TokuMX are tracked, you will know if you need to add more memory to your server. The average latency of cache misses is also monitored, so you know if your disk subsystem can handle the load.
Customize your data to fit your needs
One of the most exciting things about Datadog is you have a lot of freedom to change how you display your metrics. Datadog’s ability to filter metrics by tag is great for making dashboards that deal with a subset of TokuMX replica sets, or even collections or indexes. For example, you could generate a chart showing individual compression ratios for each collection within a single database, or you could create alerts based on log write latency for just those instances using EBS volumes.
There’s a lot more information in the Datadog TokuMX dashboard, but it’s best if you see it in action. If you want to take TokuMX and Datadog for a spin, you can download TokuMX here, read up on TokuMX internals, and then get started with the TokuMX integration for Datadog, which is available in a 14 day free trial.
