Mary Jac Heuman
Apache JMeter is an open source tool for load testing Java applications in both development and CI environments in order to ensure that sudden spikes in traffic won’t cause latency in production. But because load testing involves sending thousands of requests per minute in order to simulate real traffic, it can be difficult to parse outcomes and read patterns—especially for large organizations that test and deploy new code several times a day.
Datadog’s JMeter integration collects test result metrics in aggregate via a plugin, so you can get a quick, real-time overview of how new features affect your application’s ability to perform under stress. Datadog also ingests individual test results as log events in order to provide granular insight into what occurred during each request.
Visualize key JMeter test metrics
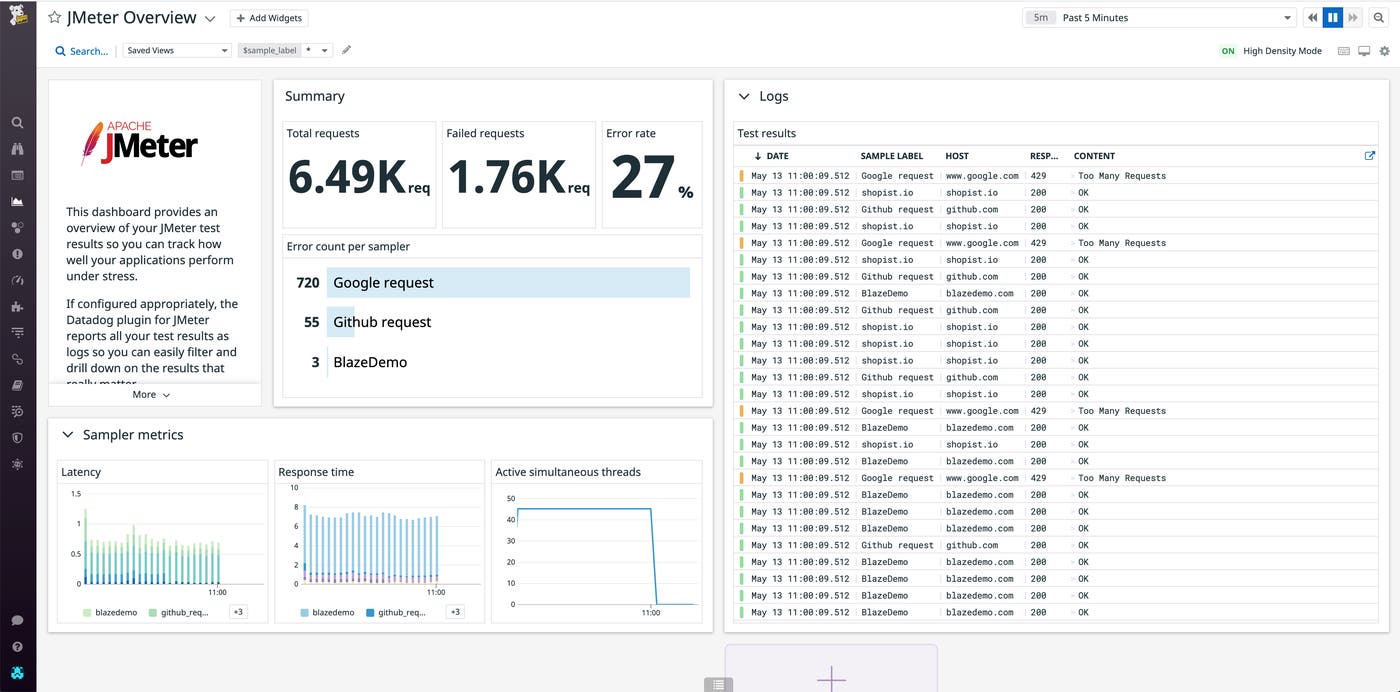
Datadog integrates with JMeter through the Datadog Backend Listener, which is an open source plugin that can be downloaded and installed from either the JMeter Plugin Manager or our own repository. Once you’ve configured the plugin, test metrics will begin streaming into an out-of-the-box dashboard, where you can get a real-time summary of results. This enables you to correlate the total number of requests, as well as the number of failed requests and the error rate, with latency and response times, which can help you determine the threshold at which your application can no longer perform as intended.

You can also clone and add widgets to the JMeter dashboard to correlate test metrics with monitoring data from elsewhere in your stack. For instance, you could add graphs of system vitals like CPU and memory in order to observe how increased traffic affects resource availability. That way, you can identify where code changes might be causing performance regression in order to observe how increased traffic affects resource availability.
Dive into individual test results with logs
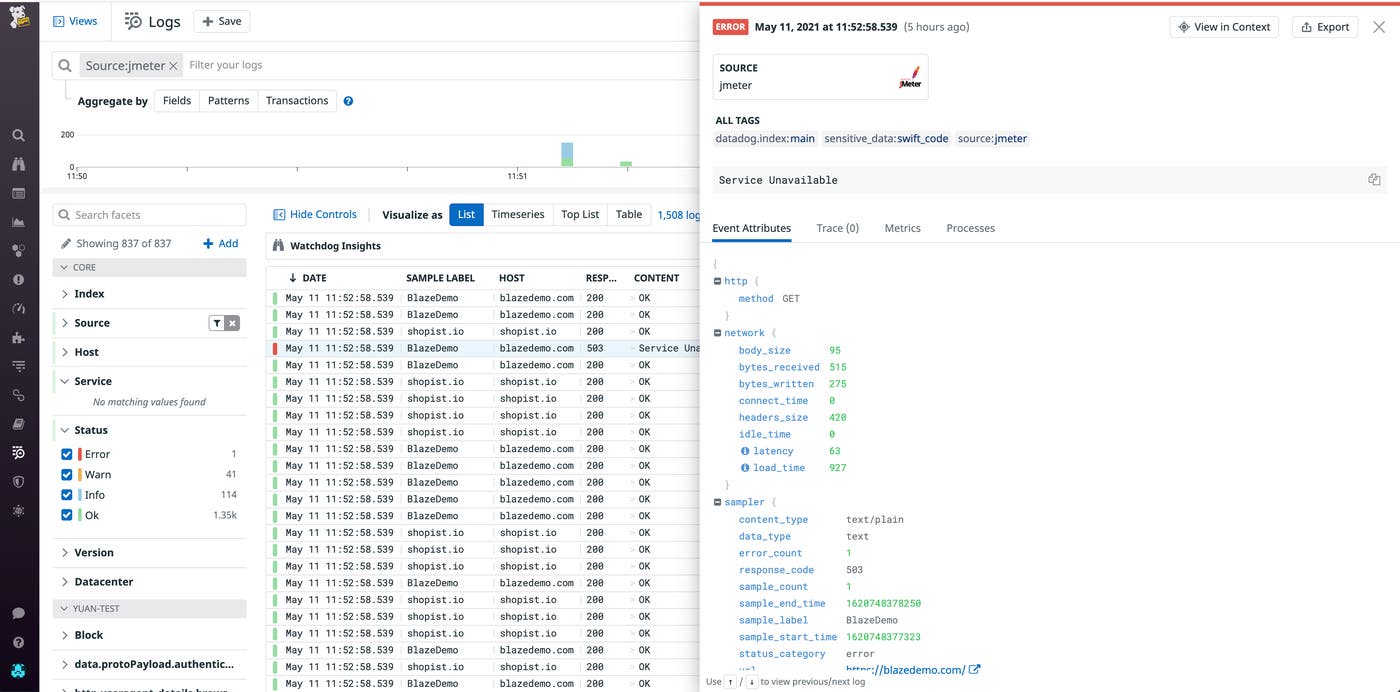
JMeter metrics can help you surface patterns and trends that occurred during testing, but because they’re aggregations of results, they don’t provide any information about what happened during individual test runs. For more granular insight, you can configure the JMeter plugin to send each test result to Datadog as a log, which will include information such as the request’s URL path, the HTTP response code, and the sampler name.

Logs appear alongside metrics in the out-of-the-box JMeter dashboard, so you can easily view the details of test runs that occurred during the same time period as concerning metric activity. You can also pivot to the Log Explorer, where you can view your JMeter logs in context and zero in on subsets of logs, such as those that received error responses or show latency that is greater than a certain value. This ability to slice-and-dice results can help you hone in on highly specific patterns that occur when your application is running under stress.
Start monitoring JMeter test data today
Load testing during development and in CI pipelines enables you to anticipate how code changes will affect your application’s performance in the wild, so you can fix any issues before they reach production. Datadog integrates with JMeter so you can easily visualize and analyze your load testing data—and correlate it with other telemetry from across your stack.
Check out our documentation for more information on the data you can collect from JMeter. Or, if you’re not signed up with Datadog, get started with a 14-day free trial.


