

This is a guest post from Nuno Sousa, Senior Developer at Uphold, and creator of Datadog’s integration with Home Assistant.
Home Assistant is an open source platform that enables you to track and automate the state of your home devices. Home Assistant can be expanded and customized with components that control and/or track the state of IoT devices (e.g. sensors, switches) and services like weather data.
While Home Assistant is great for controlling and automating your IoT devices, Datadog takes it to another level by enabling you to aggregate, analyze, and monitor everything you do with Home Assistant. For example, once you send Home Assistant metrics to Datadog, you can:
- Detect anomalies and spikes in temperatures
- Correlate events with device malfunctions
- Set alerts for Z-Wave message relay failures
- Identify trends in power usage
Monitoring Home Assistant with Datadog
After you set up the Datadog component, Home Assistant will listen for state changes in each device/entity and push the latest values of each of the entity’s attributes to the Datadog Agent, tagged with the name of the entity.
For example, the sun component uses your location to track the sun, which is useful for automating events that are triggered based on the sun’s elevation or azimuth. Whenever this component’s sun.sun entity changes state, it sends the latest values of its elevation and azimuth attributes to Datadog as metrics called hass.sun.elevation and hass.sun.azimuth, each tagged with entity:sun.sun.
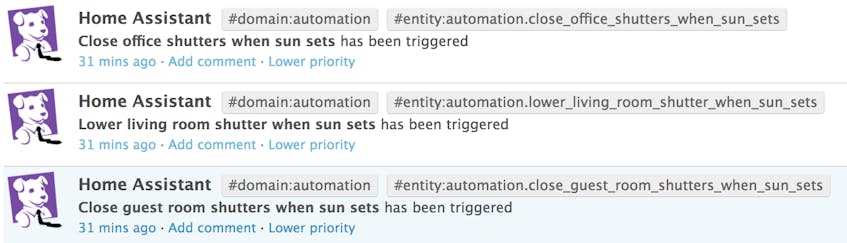
Logbook entries are also sent as events to Datadog (and tagged with domain and entity), allowing you to correlate between triggered automations and metrics.
For example, the following graph shows a plant sensor’s light intensity correlated with shutter opening/closing events:
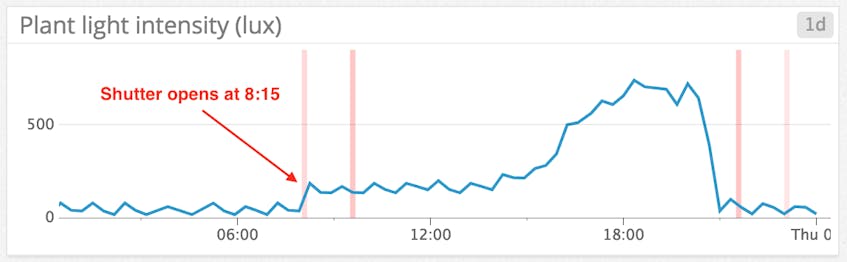
As you can probably tell from the sharp increase in brightness at 8:15 a.m., this plant is placed right beside the window!
Visualize Home Assistant metrics in dashboards
Since each home is different, you’ll need to create your own dashboard(s) in order to visualize the data that’s most important to you.
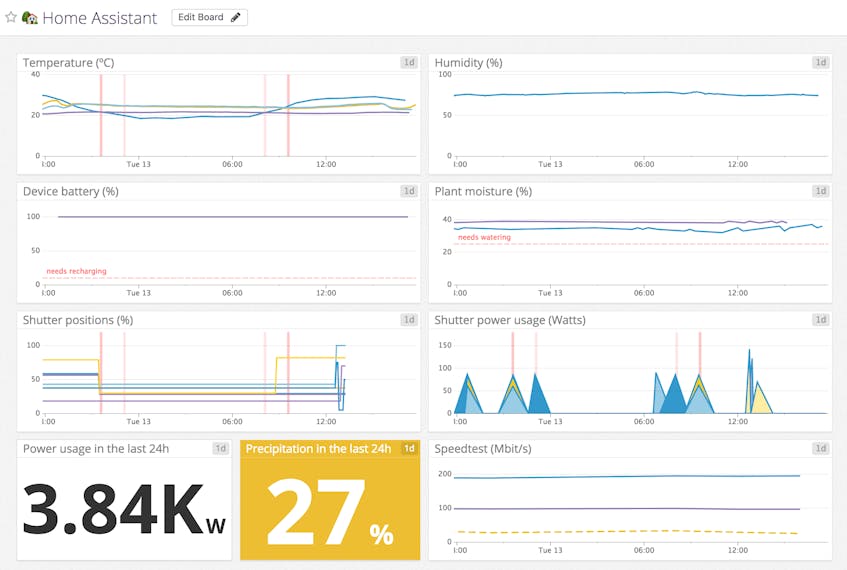
The example dashboard above displays metrics across multiple Home Assistant components:
- Temperature data from two plant sensors, a 3D printer enclosure, and YR.no forecasts in a single graph
- Humidity from a 3D printer enclosure that is currently in the basement
- Battery levels of multiple devices: a Z-Wave door sensor, a Z-Wave motion sensor, and an iPhone
- Plant moisture from a couple of Xiaomi Mi Flora sensors (along with a marker to let me know when to water them!)
- Current shutter positions in my house, correlated with automation events
- Multiple power metrics to allow me to monitor and keep my power consumption in check
- Speedtest measurements that help me find out if my ISP is having problems
Configure the integration
To configure the integration, you’ll need to have the Datadog Agent installed on a host (if you’re new to Datadog, here’s a free trial). Then all you need to do is add the following to your Home Assistant configuration.yaml file:
datadog:
  host: x.x.x.x
In the host variable, you should specify the IP address of a host that is running the Datadog Agent (or let it default to localhost). Other optional configuration variables are port , prefix , and rate. You can learn more about these options and their default values in the documentation.
Now just restart Home Assistant and you’re good to go!
