Evan Mouzakitis
This post is part 4 of a 4-part series on monitoring Hadoop health and performance. Part 1 gives a general overview of Hadoop’s architecture and subcomponents, Part 2 dives into the key metrics to monitor, and Part 3 details how to monitor Hadoop performance natively.
If you’ve already read our post on collecting Hadoop metrics, you’ve seen that you have several options for ad hoc performance checks. For a more comprehensive view of your cluster’s health and performance, however, you need a monitoring system that continually collects Hadoop statistics, events, and metrics, that lets you identify both recent and long-term performance trends, and that can help you quickly resolve issues when they arise.
This post will show you how to set up detailed Hadoop monitoring by installing the Datadog Agent on your Hadoop nodes.

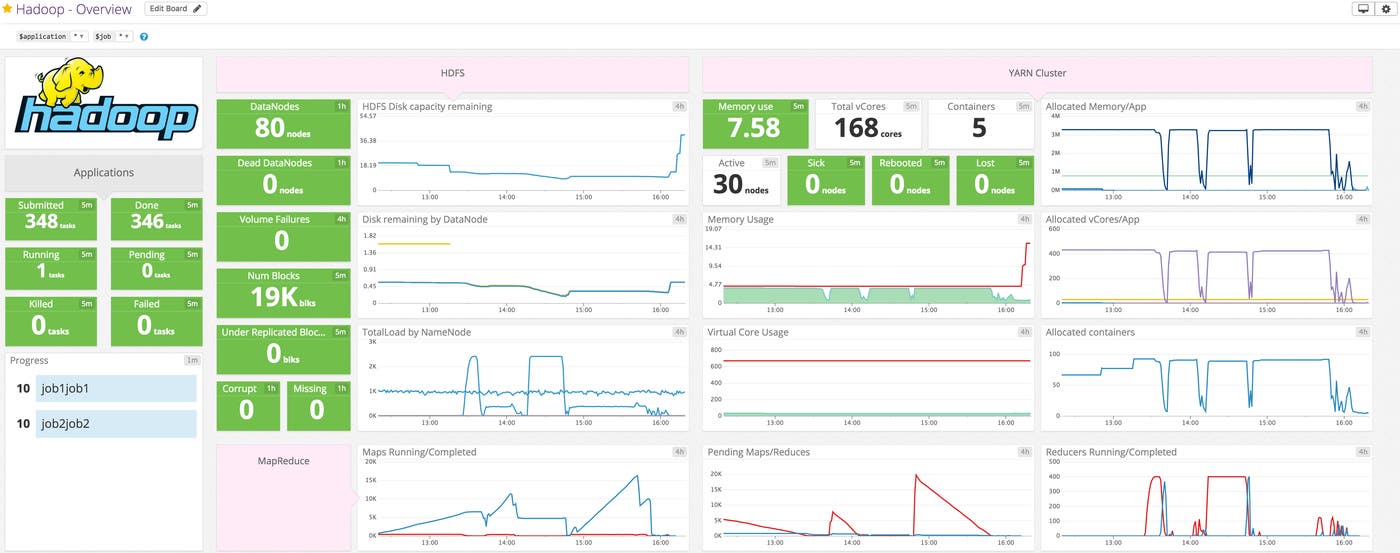
With Datadog, you can collect Hadoop metrics for visualization, alerting, and full-infrastructure correlation. Datadog will automatically collect the key metrics discussed in parts two and three of this series, and make them available in a template dashboard, as seen above.
Integrating Datadog, Hadoop, and ZooKeeper
Verify Hadoop and ZooKeeper status
Before you begin, you should verify that all Hadoop components, including ZooKeeper, are up and running.
Hadoop
To verify that all of the Hadoop processes are started, run sudo jps on your NameNode, ResourceManager, and DataNodes to return a list of the running services.
Each service should be running a process which bears its name, i.e. NameNode on NameNode, etc:
[hadoop@sandbox ~]$ sudo jps 2354 NameNode [...]ZooKeeper
For ZooKeeper, you can run this one-liner which uses the 4-letter-word ruok:
echo ruok | nc <ZooKeeperHost> 2181
If ZooKeeper responds with imok, you are ready to install the Agent.
Install the Datadog Agent
The Datadog Agent is the open source software that collects and reports metrics from your hosts so that you can view and monitor them in Datadog. Installing the Agent usually takes just a single command.
Installation instructions for a variety of platforms are available here.
As soon as the Agent is up and running, you should see your host reporting metrics in your Datadog account.

Configure the Agent
Next you will need to create Agent configuration files for your Hadoop infrastructure. In the Agent configuration directory, you will find template configuration files for the NameNode, DataNodes, MapReduce, YARN, and ZooKeeper. If your services are running on their default ports (50075 for DataNodes, 50070 for NameNode, 8088 for the ResourceManager, and 2181 for ZooKeeper), you can copy the templates without modification to create your config files.
On your NameNode:
cp hdfs_namenode.yaml.example hdfs_namenode.yaml
On your DataNodes:
cp hdfs_namenode.yaml.example hdfs_namenode.yaml
On your (YARN) ResourceManager:
cp mapreduce.yaml.example mapreduce.yaml
cp yarn.yaml.example yarn.yaml
Lastly, on your ZooKeeper nodes:
cp zk.yaml.example zk.yaml
Windows users: use copy in place of cp
Verify configuration settings
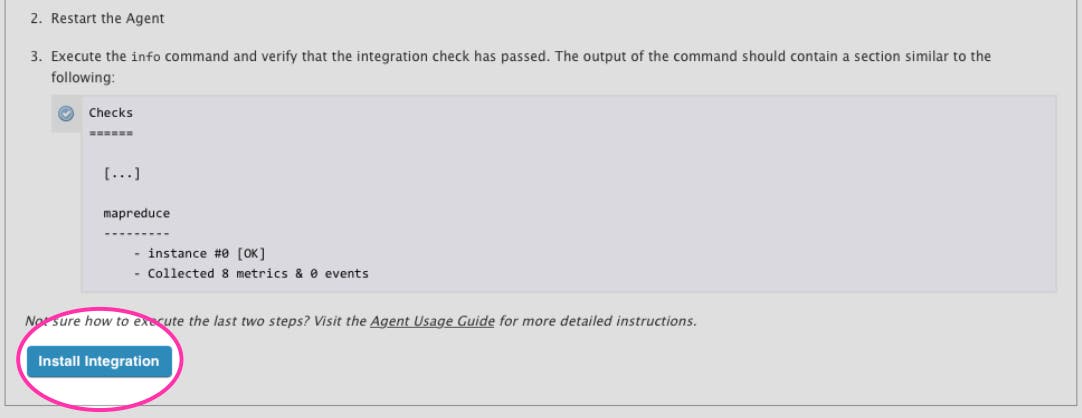
To verify that all of the components are properly integrated, on each host restart the Agent and then run the Datadog info command. If the configuration is correct, you will see a section resembling the one below in the info output,:
Checks
====== [...] hdfs_datanode ------------- - instance #0 [OK] - Collected 10 metrics, 0 events & 2 service checks hdfs_namenode ------------- - instance #0 [OK] - Collected 23 metrics, 0 events & 2 service checks
mapreduce --------- - instance #0 [OK] - Collected 4 metrics, 0 events & 2 service checks
yarn ---- - instance #0 [OK] - Collected 38 metrics, 0 events & 4 service checksEnable the integrations
Next, click the Install Integration button for HDFS, MapReduce, YARN, and ZooKeeper under the Configuration tab in each technology’s integration settings page.

Show me the metrics!
Once the Agent begins reporting metrics, you will see a comprehensive Hadoop dashboard among your list of available dashboards in Datadog.
The Hadoop dashboard, as seen at the top of this article, displays the key metrics highlighted in our introduction on how to monitor Hadoop.

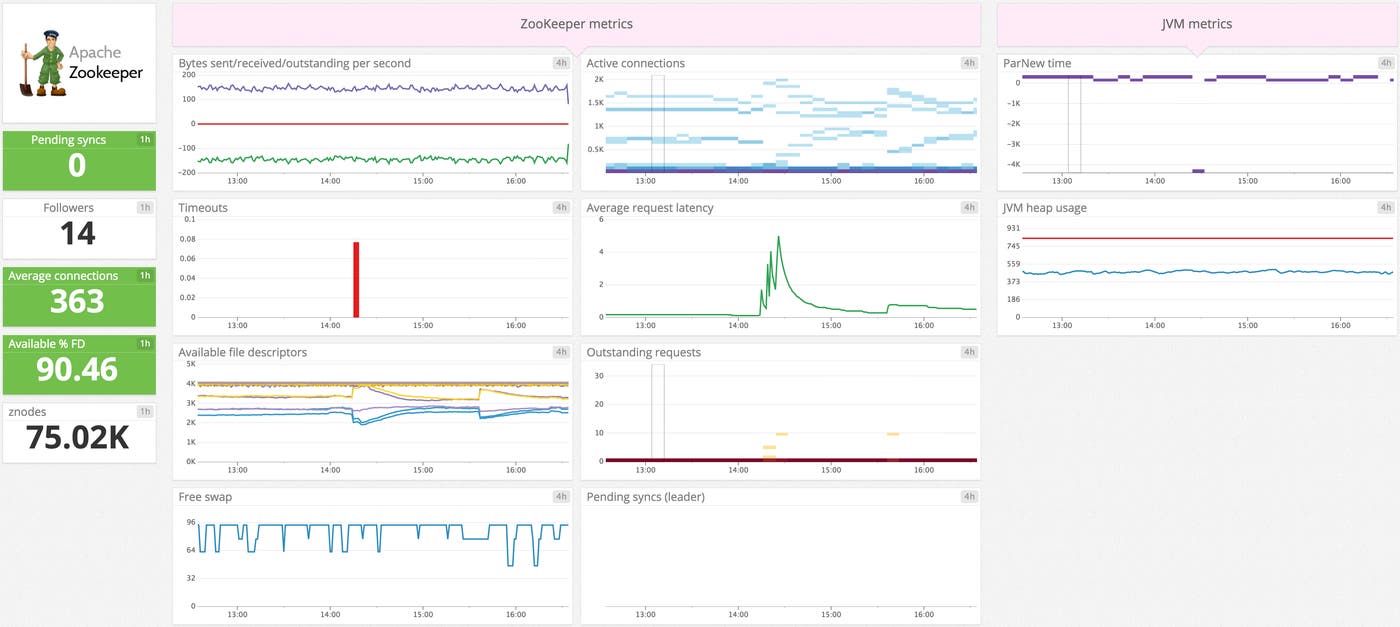
The default ZooKeeper dashboard above displays the key metrics highlighted in our introduction on how to monitor Hadoop.
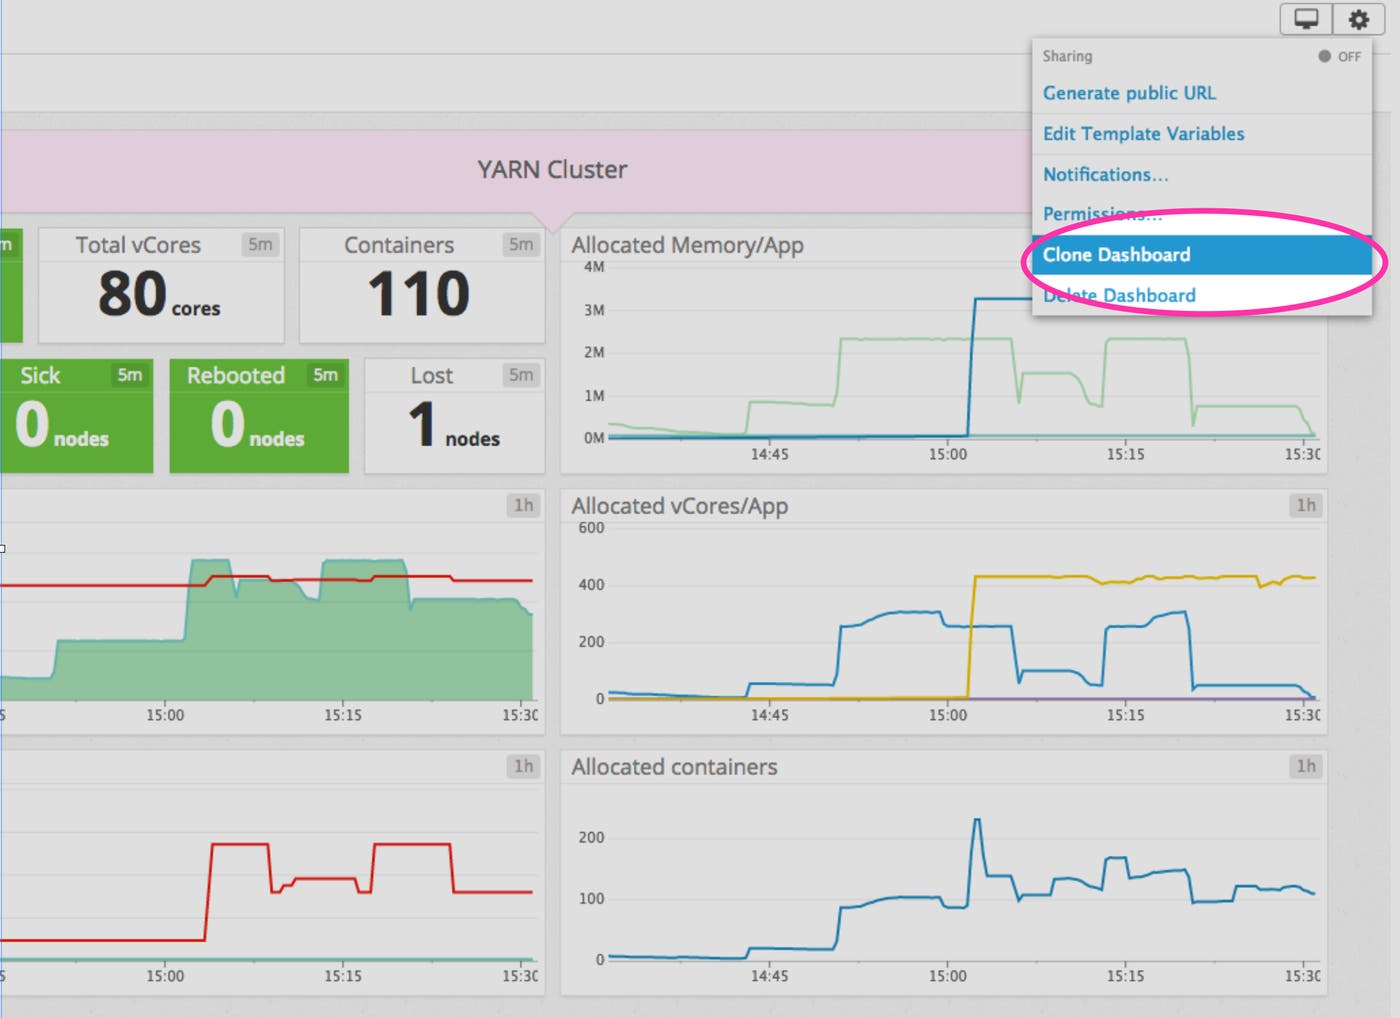
You can easily create a more comprehensive dashboard to monitor your entire data-processing infrastructure by adding additional graphs and metrics from your other systems. For example, you might want to graph Hadoop metrics alongside metrics from Cassandra or Kafka, or alongside host-level metrics such as memory usage on application servers. To start building a custom dashboard, clone the template Hadoop dashboard by clicking on the gear on the upper right of the dashboard and selecting Clone Dash.

Alerting
Once Datadog is capturing and visualizing your metrics, you will likely want to set up some alerts to be automatically notified of potential issues.
Datadog can monitor individual hosts, containers, services, processes—or virtually any combination thereof. For instance, you can view all of your DataNodes, NameNodes, and containers, or all nodes in a certain availability zone, or even a single metric being reported by all hosts with a specific tag. Datadog can also monitor Hadoop events, so you can be notified if jobs fail or take abnormally long to complete.
Start monitoring today
In this post we’ve walked you through integrating Hadoop with Datadog to visualize your key metrics and set alerts so you can keep your Hadoop jobs running smoothly. If you’ve followed along using your own Datadog account, you should now have improved visibility into your data-processing infrastructure, as well as the ability to create automated alerts tailored to the metrics and events that are most important to you. If you don’t yet have a Datadog account, you can sign up for a free trial and start monitoring Hadoop right away.
Source Markdown for this post is available on GitHub. Questions, corrections, additions, etc.? Please let us know.


