

Gunicorn, or Green Unicorn, is a UNIX-compatible WSGI HTTP server that is commonly used to run Python applications. Developed in 2010 by Benoit Chesneau, this open source project is similar to uWSGI, mod_wsgi, and CherryPy. Gunicorn is often implemented with a reverse proxy server like NGINX, which typically handles requests for static resources and then passes on the requests to Gunicorn. Gunicorn processes the dynamic portion of the request and returns a response to NGINX, which sends the response back to the client.
Gunicorn can be used to serve Python applications and is compatible with frameworks like Django and Flask. It’s easy to configure, lightweight, and only needs 4–12 worker processes to handle hundreds or thousands of requests per second.
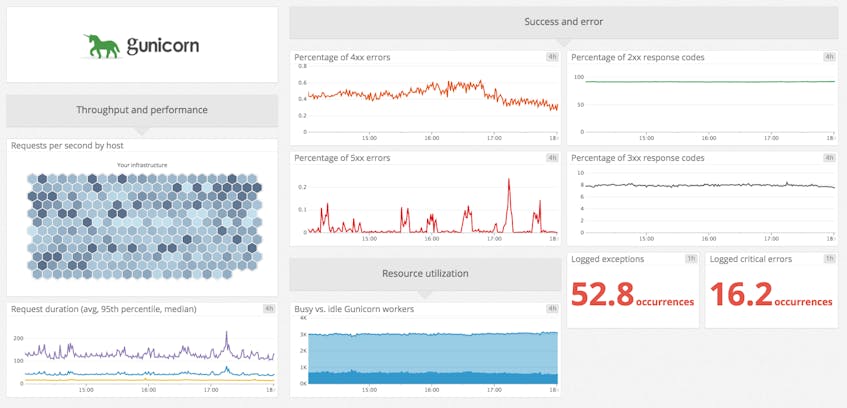
As shown in the screenshot above, Datadog’s out-of-the-box Gunicorn dashboard shows you information ranging from resource utilization to work metrics such as request duration and the rate of successful requests. With Datadog, you can start monitoring Gunicorn’s performance alongside other elements of your infrastructure, so you’ll be ready to investigate issues when they arise.
Datadog + Gunicorn
Our integration with Gunicorn collects several categories of metrics:
- latency: including the average and maximum request duration
- throughput:
gunicorn.requests, the number of requests per second - HTTP status codes: metrics such as the rate of 5xx errors help you stay on top of potential server issues
- resource utilization:
gunicorn.workers, so you can make sure you are designating the right number of workers to support your application
Note that in order to collect most of the metrics listed above, including status codes and request duration, you will need to point Gunicorn to your StatsD server, as outlined here.
Investigate issues as they arise
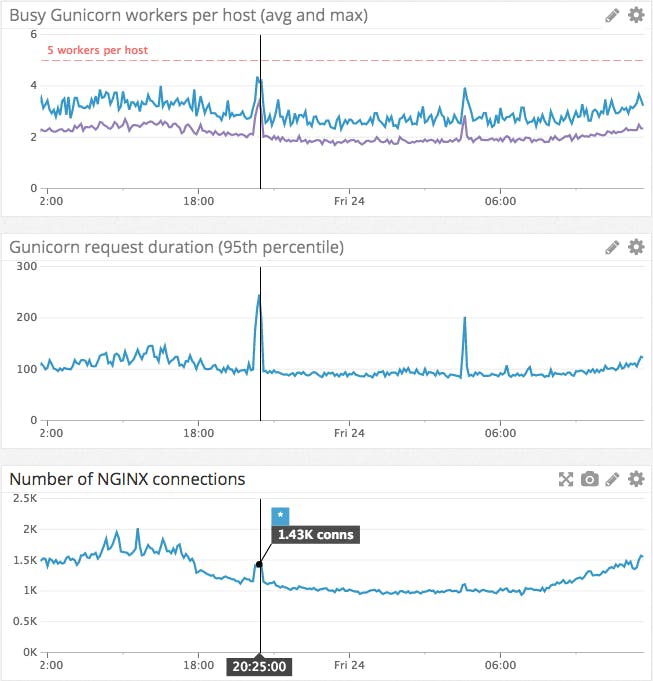
You can use Datadog to monitor Gunicorn alongside NGINX and custom metrics from your web application to understand what’s happening in your infrastructure. In the screenshot below, you can see that the number of busy Gunicorn workers, the 95th percentile of Gunicorn request duration, and average NGINX connections peak at roughly the same time.
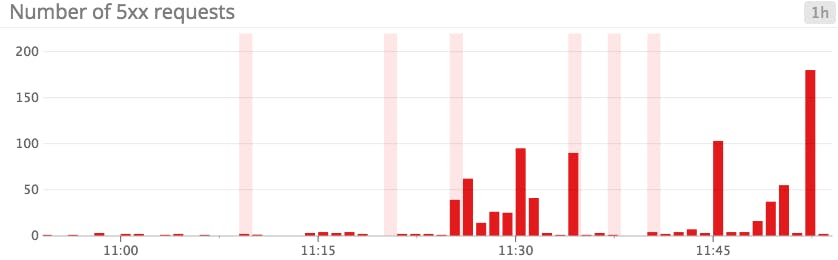
You can also correlate Gunicorn metrics with events like code deploys. For example, the screenshot below shows the number of 5xx errors overlaid with all releases tagged “hotfix” (indicated by the pink bars). If any particular hotfix event correlates with a spike, you may want to investigate if that update caused issues for your web servers.
Set up targeted alerts
Create alerts to keep tabs on Gunicorn and make adjustments to your configuration when needed. For example, you may want to set up alerts to find out when:
- there is an unusually low number of workers (
gunicorn.workers) available - the percentage of workers being utilized is high (for example: > 85%), indicating that you may want to scale up
- the 95th percentile duration of responses has increased above an acceptable threshold
Start monitoring Gunicorn
If you’re already using Datadog, you can start monitoring Gunicorn by following these instructions. If you don’t yet have a Datadog account, sign up for a 14-day free trial here.
