

Google Cloud SQL is a fully managed service that enables users to easily set up, maintain, and scale MySQL databases (with PostgreSQL support currently in beta). Hosted on Google Cloud Platform, Cloud SQL automatically handles software updates and enables users to configure automated backups and failover to ensure high availability.
Without full visibility into your Google Cloud SQL databases, it can be difficult to track availability, resource usage, and other metrics that are critical to your applications. Thanks to our Google Cloud SQL integration, you can monitor all of these metrics and more in the same place as the rest of your Google Cloud infrastructure and applications.
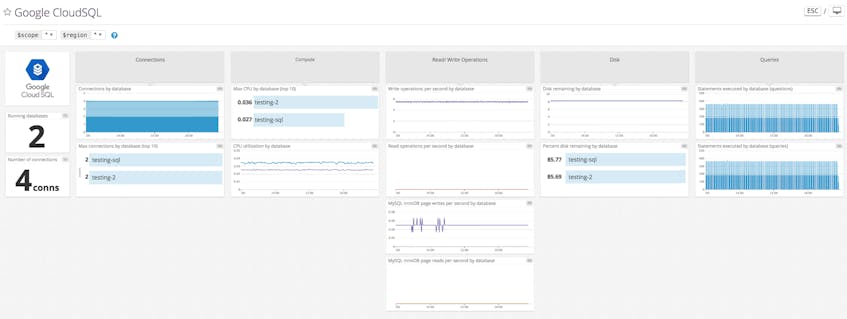
Key Cloud SQL metrics to monitor
Once you enable the integration, you can start monitoring your Google Cloud SQL databases in a customizable, out-of-the-box dashboard like the one shown above. This high-level overview provides visibility into the health and performance of your Cloud SQL databases, including key metrics like:
- Disk utilization: Google Cloud SQL enables users to configure second-generation instances to automatically scale up storage as needed. However, if you have not configured this option, or if you are running first-generation instances, then you need to keep a close eye on disk utilization and add more storage if possible, before writes start to fail.
- CPU: Monitoring CPU utilization can help provision your Cloud SQL instances efficiently. Unexpected periods of high CPU utilization may indicate that you need to provision additional resources for your instances. In other cases, if you notice that CPU and other resources are being underutilized, you can probably scale down.
- Connections: Keep an eye on this metric to ensure that you don’t exceed your instances’ connection limits. The Cloud SQL documentation also includes helpful tips on how to effectively manage your database connections.
- Questions: If you’re using MySQL as your database engine, the
questionsmetric tracking queries sent by clients is a valuable high-level metric to monitor. You can set up an alert to notify you to sudden drops in question throughput, which may point to throughput issues in your database or client applications.
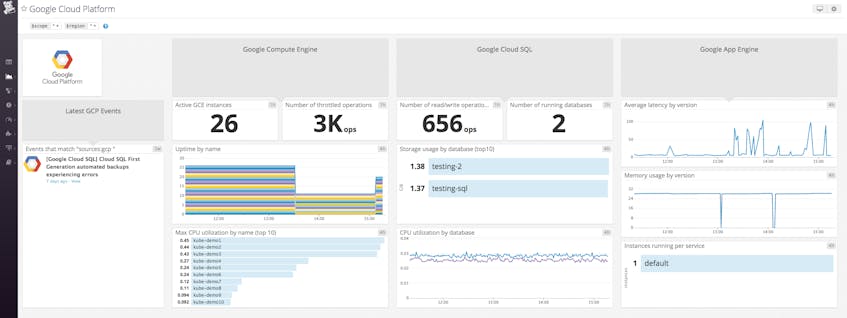
Monitor Google Cloud SQL in context
Datadog’s Google Cloud Platform integration enables you to correlate Cloud SQL performance with the rest of your Google Cloud services (plus more than 750 technologies), and analyze them all in one place. You can immediately start visualizing Google Cloud SQL, Google Compute Engine, and Google App Engine metrics in an out-of-the-box screenboard like the one shown below.
Handle any weather the cloud may bring
Datadog’s robust alerting features allow you to set up automatic alerts to detect unexpected behavior across your services. So you can trigger a notification if any individual Google Cloud SQL database goes down, or set up anomaly detection to alert you to unexpected drops in query throughput.
You can configure Datadog alerts to track any of the Cloud SQL metrics mentioned above (or see the full list of available metrics here), and trigger notifications through Slack, PagerDuty, HipChat, and other issue resolution tools. Each Cloud SQL metric is automatically tagged with identifying metadata (database_id, project, and region), so you can slice and dice your metrics to easily create custom alerts and dashboards.
Get started
If you’re already using Datadog, you can start monitoring Cloud SQL—and the rest of your Google Cloud environment—in just a few minutes with our GCP integration. If you’re new to Datadog, here’s a free 14-day full-featured trial.
