FoundationDB is a distributed NoSQL database designed to support fully ACID transactions. FoundationDB uses an unbundled architecture that consists of an in-memory transaction management system, a distributed storage system, and a built-in distributed configuration system. This enables developers using FoundationDB to manage and configure each part of their database layer separately to ensure desired scalability, high-availability, and fault tolerance.
Now, with Datadog’s new integration, you can visualize and monitor key metrics from your FoundationDB clusters. For Datadog to begin tracking these metrics, simply deploy the Datadog Agent and enable the FoundationDB integration. Once you configure the integration, data from FoundationDB will begin streaming into multiple out-of-the-box Datadog dashboards, helping you monitor key metrics from your database.
In this post, we’ll show you how to leverage Datadog’s integration to monitor your FoundationDB transactions and track coordinator status to preempt data loss.
Monitor your FoundationDB transactions
FoundationDB’s unbundled architecture decouples transaction processing from data storage. Because of this, it’s important to track performance metrics at these different levels to identify bottlenecks and other potential problems.
In FoundationDB, writes are sent to a transactional authority, where they are stored as transaction logs before they are committed to memory. A transaction is complete once a storage engine writes the new mutation to disk on a storage server, which maintains the distributed data.
Monitoring FoundationDB performance therefore requires you to monitor each step of this process, from transactions and operations to transaction log and storage queues.
Transactions and operations
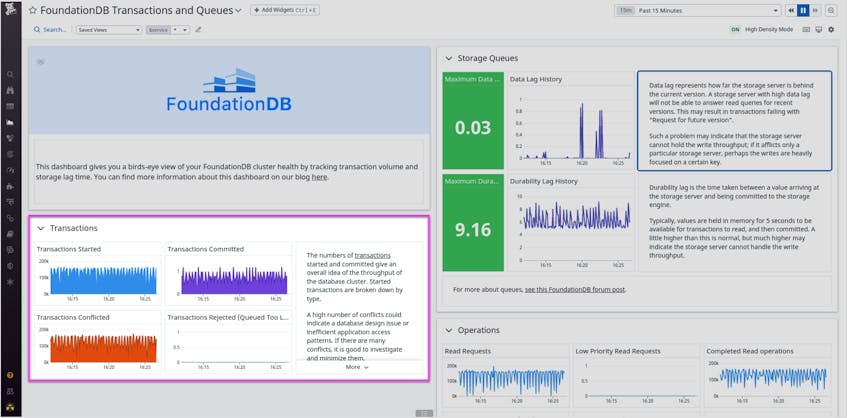
Metrics about transactions and operations, such as transactions_started or read_requests, can provide a high-level view of your FoundationDB cluster’s throughput.
Collecting transaction and operation metrics in Datadog can also help you optimize performance and avoid overloading your FoundationDB databases. For instance, let’s say you notice that the number of queued transactions keeps growing during heavy read/write traffic, and as a result, you see an increase in rejected transactions. Bottlenecks like these mean that your cluster cannot process the number of requests it is receiving. To minimize latency for your users, you might want to add nodes to your cluster to increase the number of storage servers and transaction proxies.
Log queues
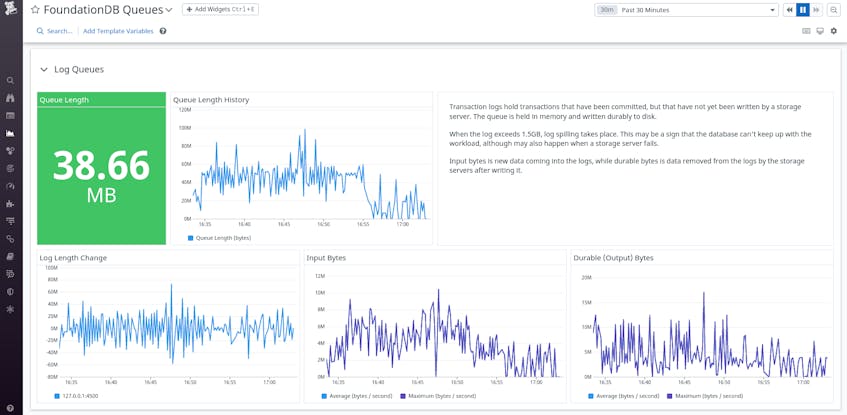
When transactions are committed, they are first temporarily written as logs and added to a queue. Storage servers asynchronously then fetch the most recently committed transactions from this queue and write them to disk. Log queues represent these transactions that are yet to be written durably to disk. It’s therefore important to monitor queue length metrics (such as those shown in the dashboard below) to make sure your transactions are not waiting too long to be processed.
If you notice a spike in your log queue length, for example, it might be because a storage server has failed and thus can no longer fetch data from the logs. When the log queue exceeds 1.5GB, the log will begin to spill, which means it will write the excess data to a separate file on disk and remove it from the queue. Spilling is an expensive process in terms of memory and speed. To prevent log spilling, you will want to deploy additional storage servers.
Storage queues
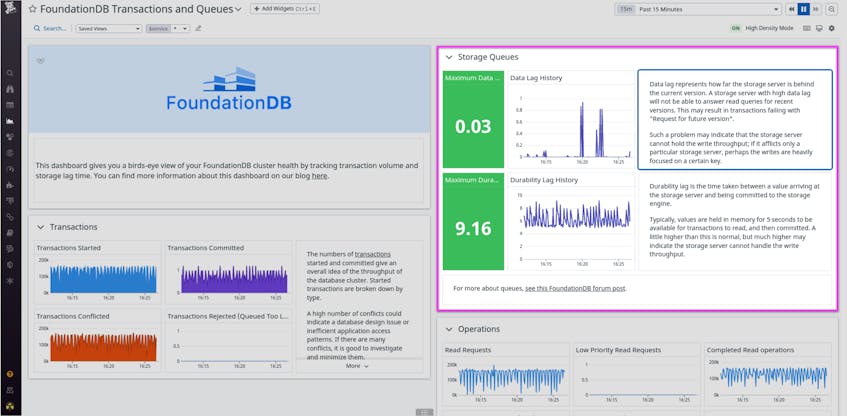
Once a transaction has moved from the transaction log queue to a storage server, the transaction is again sent to a queue to be written to disk by the storage engine. Monitoring storage queue metrics (shown in the example dashboard below) can help guide troubleshooting. For instance, if you notice the storage_lag metric increasing when you load large volumes of files into a cluster, you could try deploying more storage servers. This remediation step would distribute transactions across more storage servers, thus reducing the length of storage queues.
Track coordinator status
Coordination servers (or coordinators) manage client and server connections to the cluster. Beyond monitoring transactions and queue lengths, it’s important to track the health of your coordinators to stay ahead of potential data loss. For some background, FoundationDB requires you to assign a given number of your nodes as coordination servers to configure and maintain your distributed database. If one or more of the coordinators are down or unable to communicate with the network, the cluster may become unavailable. If you lose a majority of your coordinators, you will lose all your data and will have to restore from a backup. The coordinators_count metric lets you monitor the status of these nodes. You may want to alert on the number of active coordination servers so that you are notified as soon as any go down. In the event that you lose a coordinator, you can quickly reassign another node as a coordinator from elsewhere in your cluster to replace it, thereby avoiding any threat to system availability.
Monitor FoundationDB with the rest of your stack
Datadog’s FoundationDB integration gives you deep visibility into the health and performance of your FoundationDB clusters, enabling you to stay ahead of potential data loss and improve end-user experience. With Datadog’s FoundationDB integration, you gain powerful monitoring features, such as out-of-the-box dashboards, that give you insight into the overall health of your FoundationDB databases. Our single pane of glass allows you to monitor your transactions and track coordinator status alongside data from more than 750 other technologies.
If you’re new to Datadog, sign up for a 14-day free trial.


