
David Lentz
So far in this series, we’ve walked through key etcd metrics and tools you can use to monitor etcd metrics and logs. In this post, we’ll show you how you can monitor etcd with Datadog, including how to:
- Collect, visualize, and alert on etcd metrics
- Detect resource issues in your etcd containers and pods
- Collect and explore etcd logs
But first, we’ll show you how to set up and configure the Datadog Agent and Cluster Agent to send etcd monitoring data to your Datadog account.
Integrate etcd with Datadog
The Datadog Agent is open source software that collects monitoring data from the hosts in your environment, including your etcd nodes. Although you have several options for installing the Agent in a Kubernetes cluster, we recommend using the Datadog Operator, which lets you efficiently install, manage, and monitor Agents in your cluster. Deploying the Operator also installs the etcd integration, which you can then enable as an Autodiscovery check by updating the Agent’s definition.
The code snippet below includes the etcd integration’s configuration data in the configDataMap section. It shows placeholder values for your Datadog API key, application key, cluster name, and the locations of the certificates etcd uses to communicate securely. These locations vary across different cloud services and Kubernetes distributions; see the documentation for details. Note that this code snippet also sets tlsVerify to false, which allows the Agent to monitor the Service on each node.
kind: DatadogAgentapiVersion: datadoghq.com/v2alpha1metadata: name: datadogspec: global: credentials: apiKey: <YOUR_API_KEY> appKey: <YOUR_APP_KEY> clusterName: <YOUR_CLUSTER_NAME> kubelet: tlsVerify: false # Setting this to false lets the Agent discover # the kubelet URL. override: nodeAgent: image: name: gcr.io/datadoghq/agent:latest extraConfd: configDataMap: etcd.yaml: |- ad_identifiers: - etcd init_config: instances: - prometheus_url: https://%%host%%:2379/metrics tls_ca_cert: /host/etc/kubernetes/pki/etcd/ca.crt tls_cert: /host/etc/kubernetes/pki/etcd/server.crt tls_private_key: /host/etc/kubernetes/pki/etcd/server.key containers: agent: volumeMounts: - name: etcd-certs readOnly: true mountPath: /host/etc/kubernetes/pki/etcd - name: disable-etcd-autoconf mountPath: /etc/datadog-agent/conf.d/etcd.d volumes: - name: etcd-certs hostPath: path: /etc/kubernetes/pki/etcd - name: disable-etcd-autoconf emptyDir: {} tolerations: - key: node-role.kubernetes.io/master operator: Exists effect: NoScheduleYou can use the following kubectl command to apply these changes:
kubectl apply -f datadog-agent.yamlInstalling the Agent via the Operator also enables the Cluster Agent, which is not only designed to collect cluster-level monitoring data more efficiently but also lets you use custom metrics to autoscale your cluster. The Cluster Agent includes the kube-state-metrics integration, which collects performance data from your containers and pods, as well as Kubernetes workload resources such as Deployments, Jobs, and ReplicaSets. In the next section, we’ll show you how you can combine metrics from the etcd integration and kube-state-metrics to better understand how etcd’s performance affects Kubernetes and vice versa.
Collect, visualize, and alert on etcd metrics
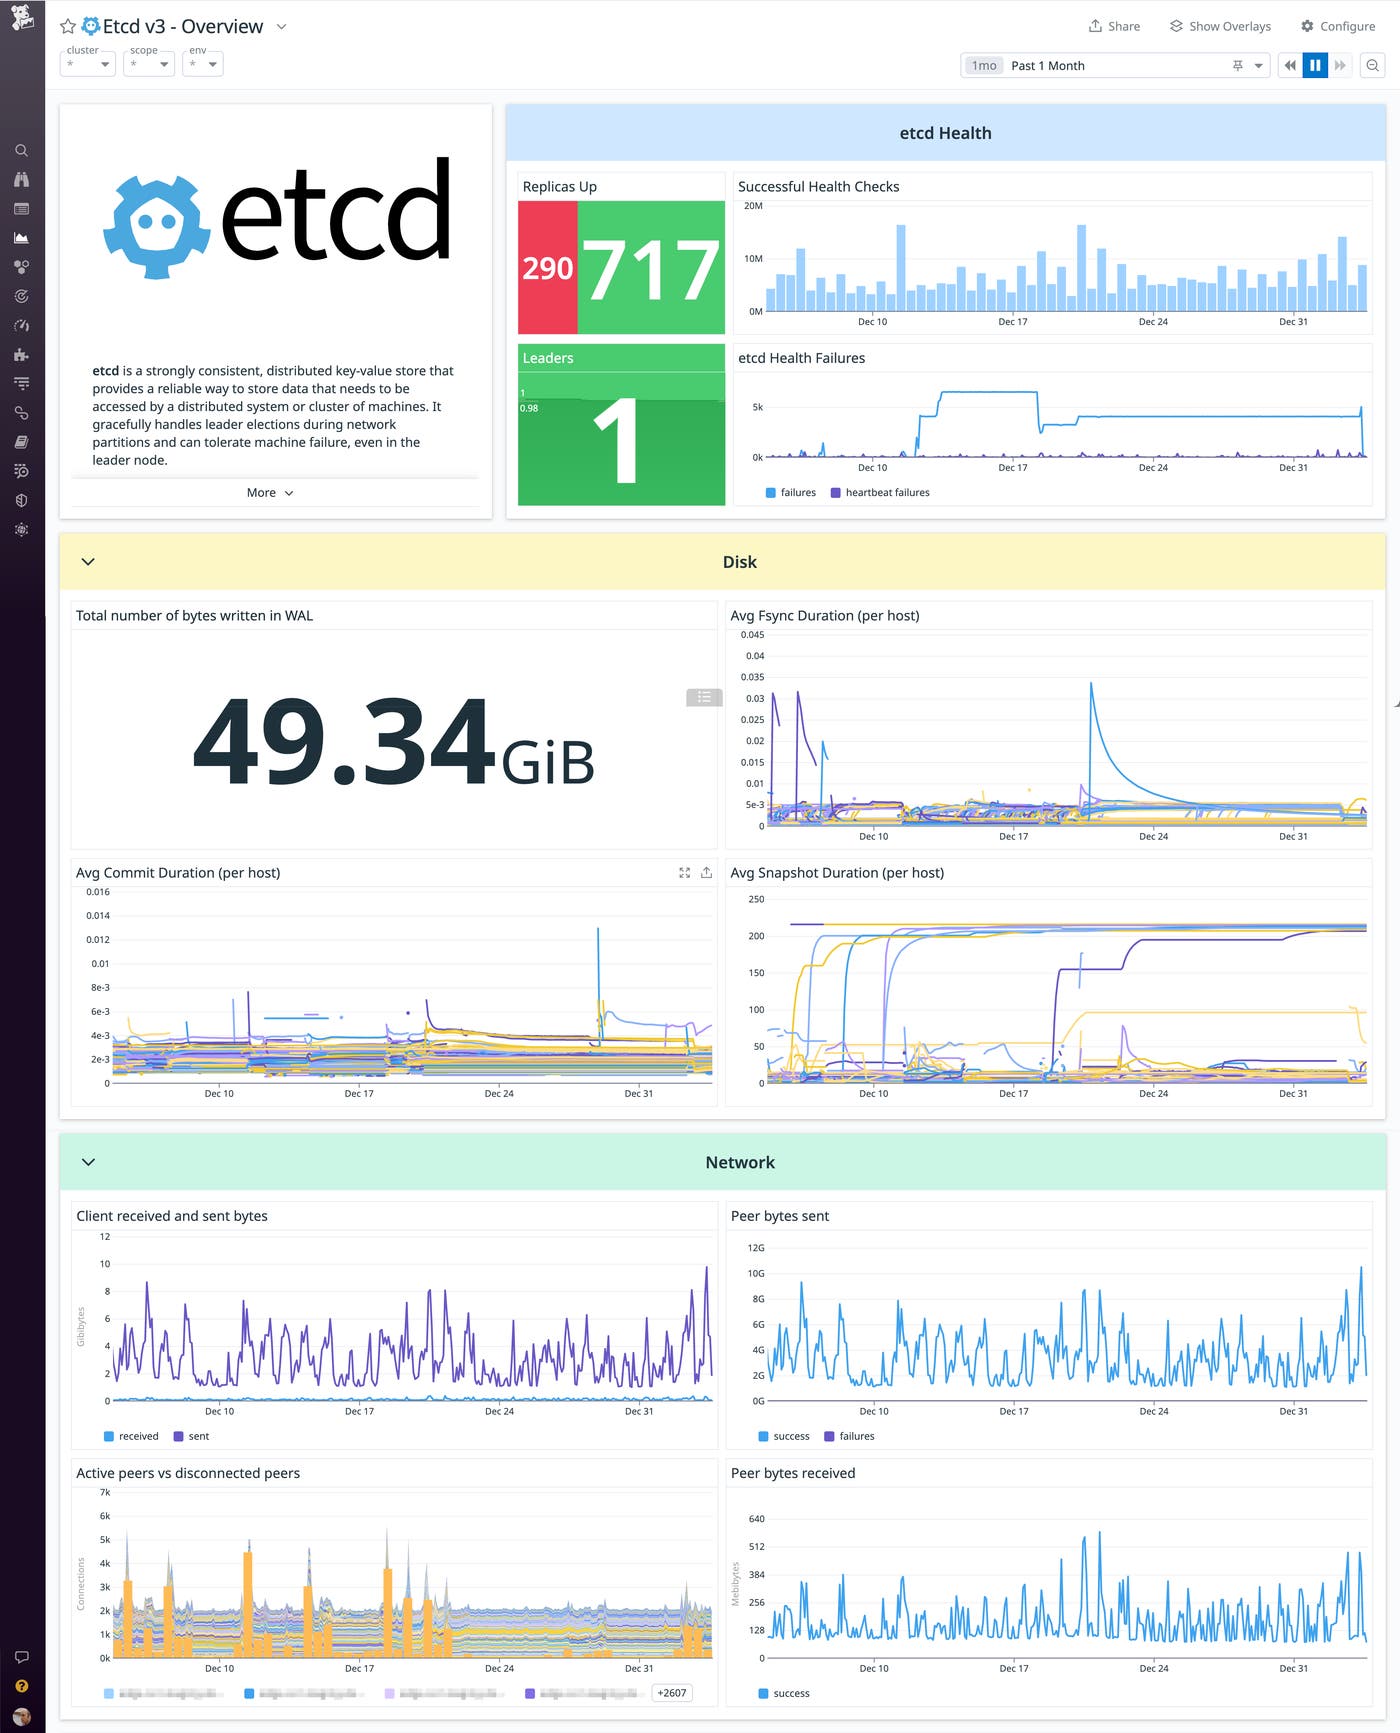
Datadog’s out-of-the-box etcd dashboard lets you visualize your etcd cluster’s performance, resource utilization, and Raft activity. The screenshot below shows a portion of the dashboard highlighting proposal activity and leadership changes. This can help you quickly spot failed proposals that are correlated with a high rate of leadership changes, as well as nodes that aren’t applying proposals quickly enough.
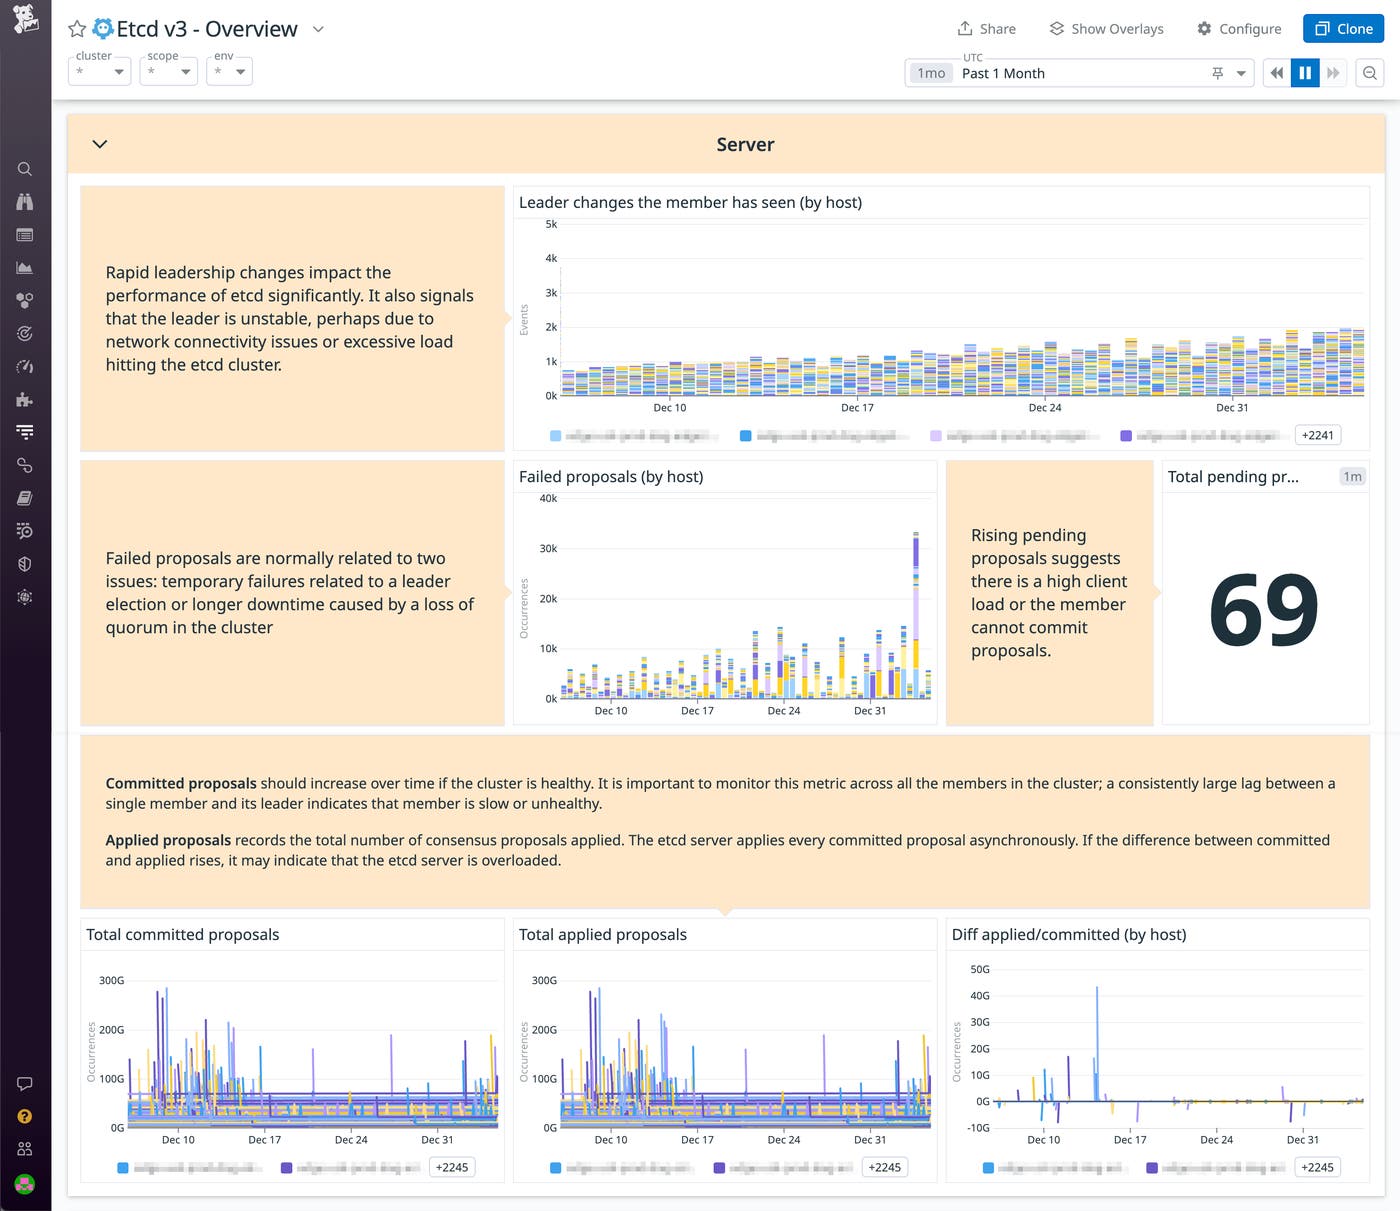
You can customize this dashboard by adding widgets and Powerpacks to visualize related information and spot correlations between etcd metrics and kube-state-metrics. For example, graphing node resource metrics from the kube-state-metrics integration alongside your etcd data can help you see whether a node that’s slow to apply proposals is also affected by resource constraints.
Use tags to analyze your etcd metrics
The Agent automatically tags your etcd metrics, enabling you to easily filter and aggregate them according to your needs. For example, you can use the cluster_name or host tag—which the Agent applies automatically—to filter your metrics to visualize the performance of a single cluster or even a single host. You can also group metrics to easily compare performance across clusters. The screenshot below shows how you can leverage the host tag to see the number of failed proposals on each host in the cluster over the last week. Failed proposals can happen during leader elections, but they can also indicate that an infrastructure issue—such as network disruption—is causing the cluster to lose quorum. A graph like this can help you troubleshoot the issue by making it clear whether failed proposals are happening across the cluster or only on specific hosts.

You can also configure the Agent to apply custom tags, which let you explore your data based on dimensions that matter to you. The code snippet below expands the one from above to show how you can configure the Agent to add a service tag to your etcd metrics. This tag lets you use unified service tagging to correlate etcd data with metrics from infrastructure and applications across your environment. This code also adds a team tag which can help you clarify service ownership. Together, these two tags—along with any other custom tags that are useful to your organization—can help your teams collaborate to speed up troubleshooting.
apiVersion: datadoghq.com/v2alpha1kind: DatadogAgentmetadata: name: datadogspec: global: [...] override: [...] nodeAgent: image: name: gcr.io/datadoghq/agent:latest extraConfd: configDataMap: etcd.yaml: |- [...] instances: - prometheus_url: https://%%host%%:2379/metrics tls_ca_cert: /path/to/etcd/ca.crt tls_cert: /path/to/etcd/server.crt tls_private_key: /path/to/etcd/server.key tags: - "service:etcd" - "team:web-sre" [...]Alert on etcd health and performance
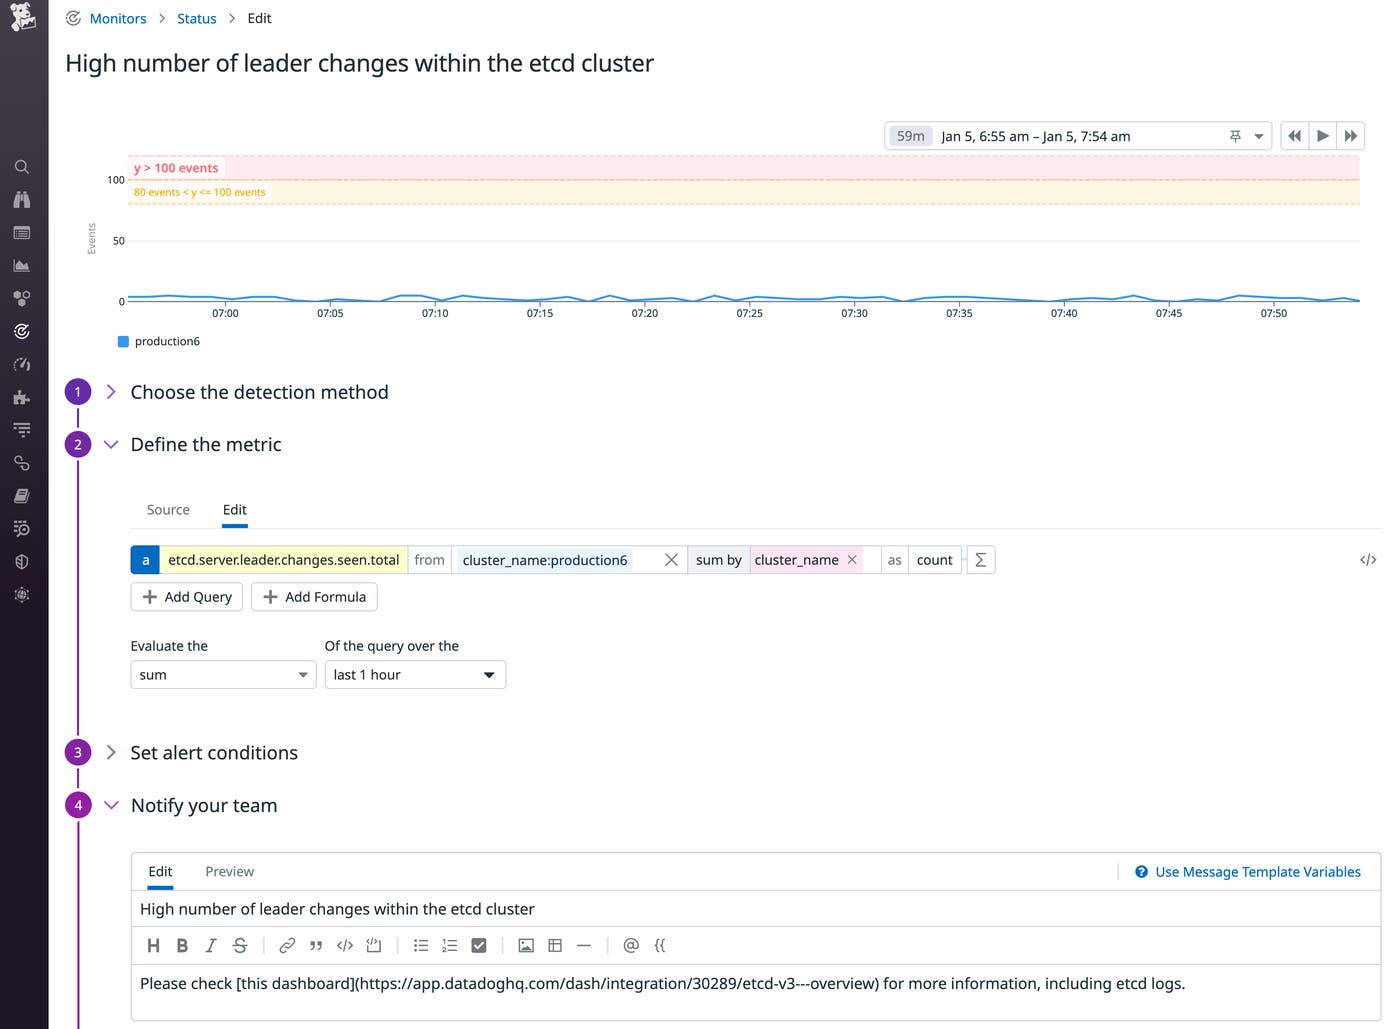
To detect and troubleshoot issues before they cause user-facing errors or latency, you can create monitors that automatically notify you of any unexpected changes in etcd metrics. The screenshot below shows a monitor that can alert you to a high value in the etcd_server_leader_changes_seen_total metric. Changes in leadership are normal, but if they happen too frequently, they can cause etcd’s performance to degrade. This monitor will automatically alert a team member if the cluster sees more than 100 leadership changes in an hour. It’s also configured to send a warning if the count rises above 80, giving a responder time to investigate the issue before it affects the etcd cluster’s performance.
Detect resource issues in your etcd containers and pods
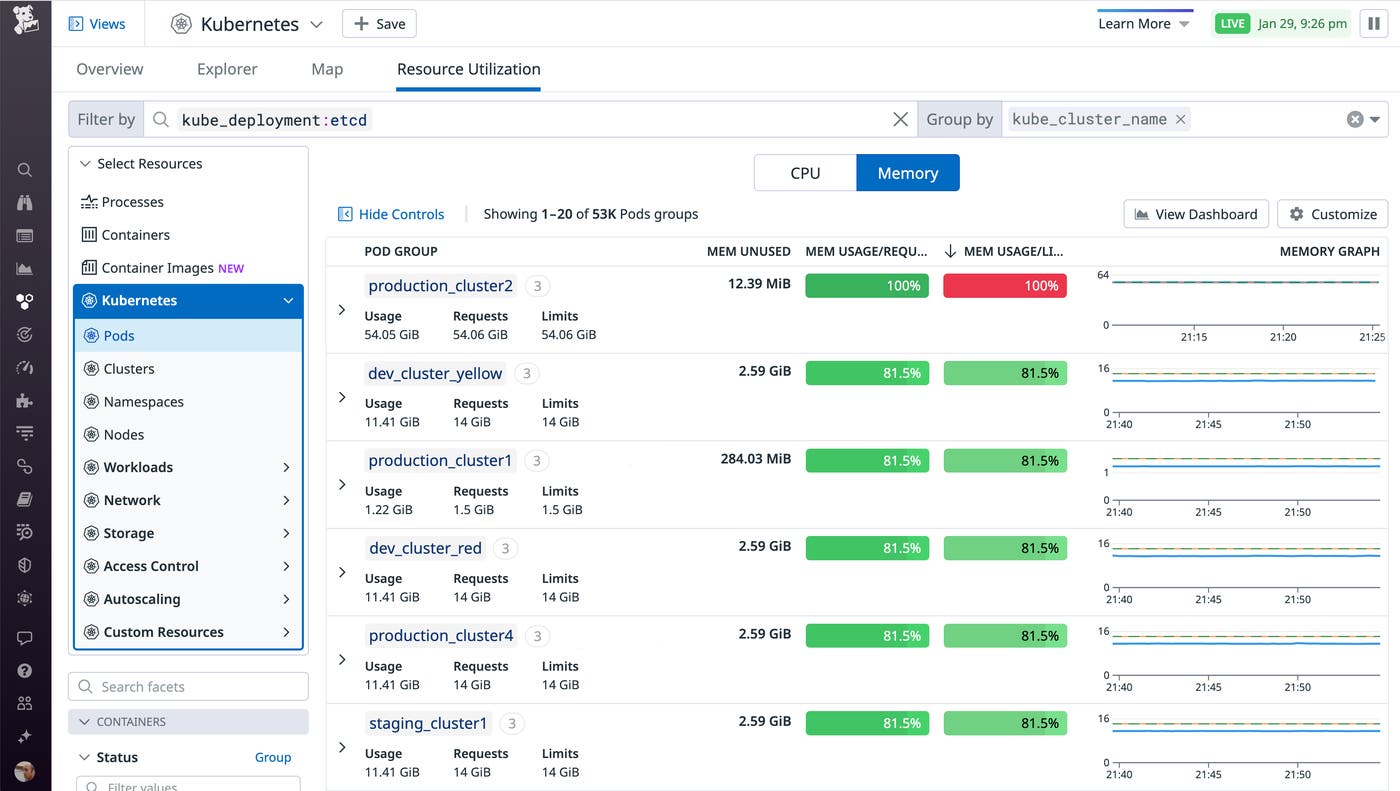
If your etcd dashboards and monitors indicate an issue with etcd’s performance, you can troubleshoot by looking for a root cause in the containers where it runs and the pods that host them. The Orchestrator Explorer is enabled by default when you use the Operator to install the Agent, and the resource utilization view helps you troubleshoot etcd performance by surfacing pod-level issues such as resource starvation. The screenshot below shows the resource utilization of the etcd pods in each cluster. The query filters pods to show only those from the etcd Deployment and groups them by cluster to show the average memory utilization across all pods in each group. Etcd pods in production_cluster2 are using 100 percent of their available memory. A resource constraint like this may degrade the performance of your Kubernetes cluster or containerized application. This could be caused by an increase in the size and activity level of your Kubernetes cluster.
Metrics from the kube-state-metrics integration (provided by the Cluster Agent) can also help you track the state of your etcd pods and containers. You can visualize or alert on metrics such as kubernetes_state.container.ready and kubernetes_state.pod.ready, for example, and filter using the service:etcd tag to focus specifically on etcd.
Collect and explore etcd logs
In Part 2 of this series, we saw how etcd uses journald to log information about its process, Raft activity, and database activity. In this section, we’ll show you how to forward logs to Datadog so you can explore and analyze them alongside logs from Kubernetes and your applications.
Enable log collection
To configure the Agent to collect etcd logs, first make sure it’s enabled to collect Kubernetes logs. Then, apply the necessary configuration for etcd logs, as described in our etcd integration documentation. The following code snippet enables logCollection and sets containerCollectAll to true to configure the Agent to collect logs from all the containers it discovers. This code also applies a team tag to the logs, enabling you to easily correlate them with the etcd metrics you already started collecting.
apiVersion: datadoghq.com/v2alpha1kind: DatadogAgentmetadata: name: datadogspec: global: [...] features: logCollection: enabled: true containerCollectAll: true override: nodeAgent: [...] extraConfd: configDataMap: etcd.yaml: |- [...] instances: [...] logs: - tags: - "team:web-sre"Explore your etcd logs
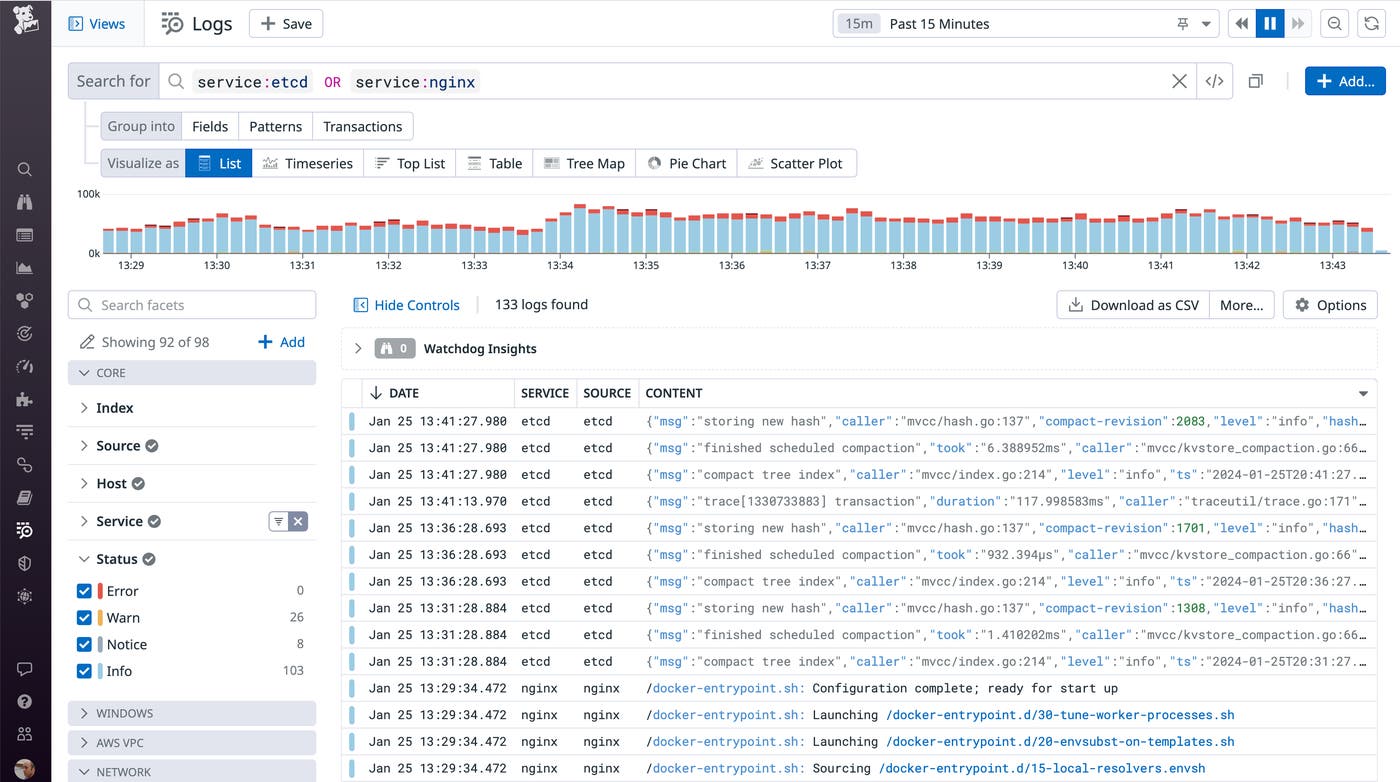
Your etcd logs are automatically tagged with source:etcd and service:etcd. The source tag triggers the etcd log pipeline so that your logs are automatically parsed and enriched as they’re brought into Datadog. The service tag lets you easily filter for etcd logs in the Log Explorer. You can expand your filter to search for multiple tags if you need to view etcd logs alongside related logs from other technologies, for example, to determine whether errors and latency in your web application are caused by an issue with etcd. The screenshot below shows how you could query for logs that are tagged with either service:etcd or service:nginx.
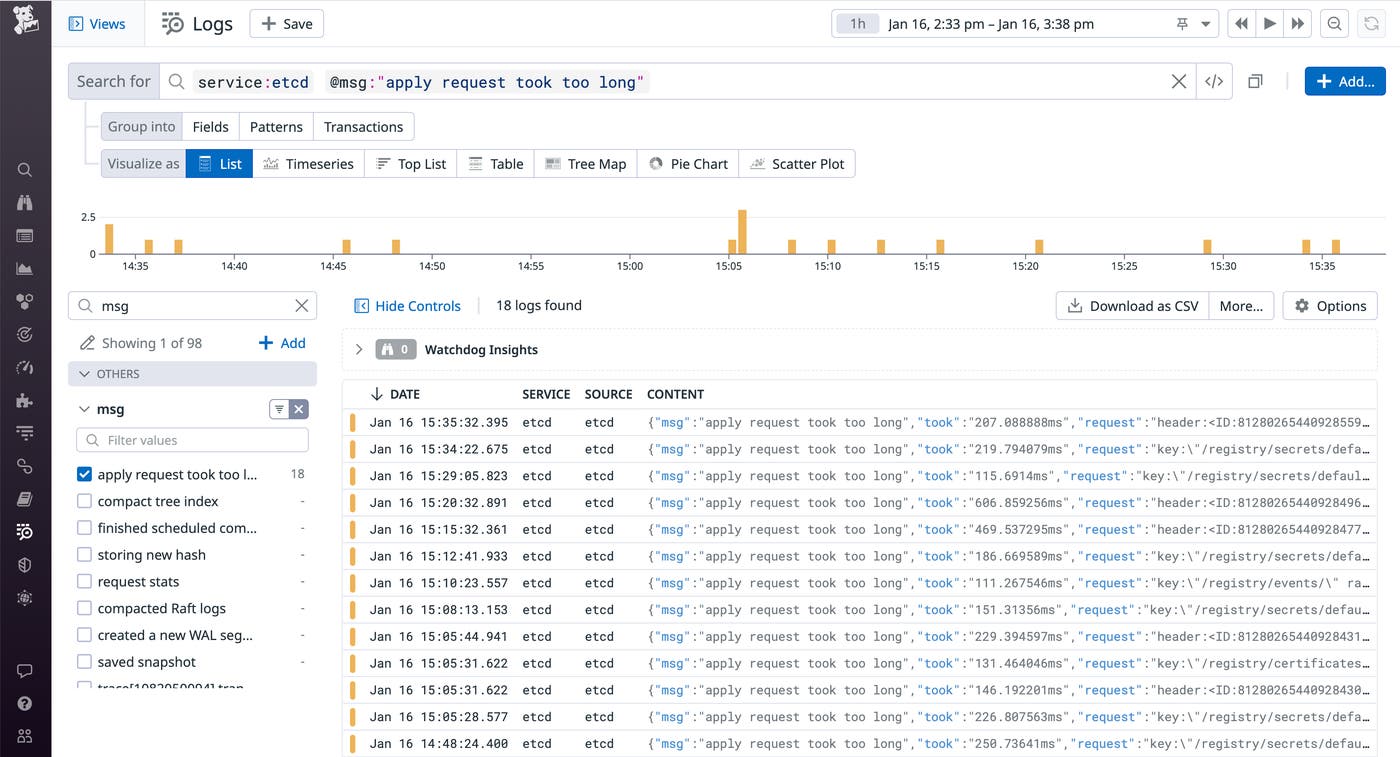
Log facets enable you to filter logs based on their content, which can help you quickly find logs that provide context around a specific issue you’re troubleshooting. For example, etcd logs a warning message if it takes longer than 100 ms to apply a proposal. If you’re investigating an increasing difference in the number of proposals committed and applied in your cluster, you can create a facet based on the msg field. This allows you to easily isolate and analyze logs that have a msg value of apply request took too long, as shown below. You can use both facets and tags to refine your search, for example, to isolate logs like this from a specific host.
Expand your Kubernetes visibility with Datadog etcd monitoring
The performance of your Kubernetes-based applications relies on a healthy etcd cluster. Datadog provides deep visibility into etcd, CoreDNS, Kubernetes, and more than 1,000 other technologies so you can monitor and alert on your clusters, applications, and infrastructure—all in a single platform.
See the documentation for information on getting started monitoring etcd, and if you’re not already using Datadog, you can start today with a free 14-day trial.


