

Modern video streaming workflows are composed of many different services, including encoders, origins, ad servers, content delivery networks (CDNs), and more. This wide range of options enables organizations to choose the tools that best fit their needs, but it also introduces considerable observability challenges. For instance, you may have limited access to the log data from each layer of your video workflow, and the data you can access likely isn’t standardized. This inconsistency makes it much harder to make correlations and identify the root cause of a streaming issue.
To overcome this challenge, Datazoom collects event-level, real-time data across different components of your streaming service—and standardizes it into easy-to-parse JSON. Our integration with Datazoom enables you to send all of your video workflow data to Datadog, where you can visualize, analyze, and alert on it in real time. In this post, we’ll look at how Datadog and Datazoom work together to provide visibility into your video player, CDN, and other components of your video streaming workflow.
Get a centralized view of all your video workflow data
Once you enable the integration, telemetry from Datazoom will become available in an out-of-the-box dashboard, providing a centralized view of the health and performance of your streaming service.
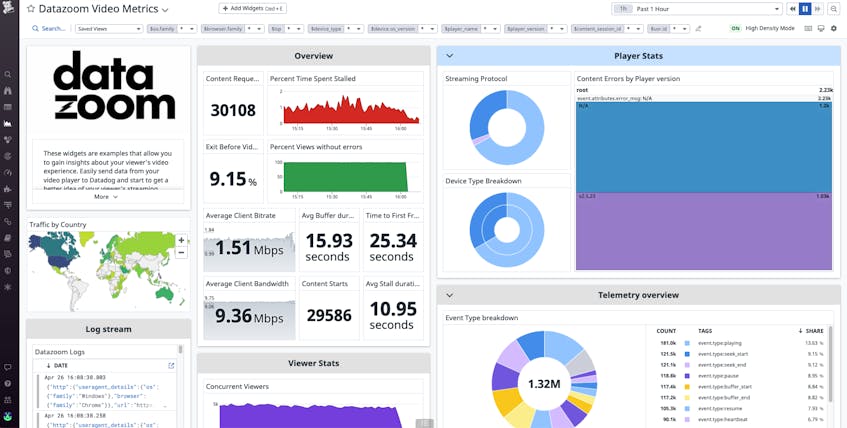
The dashboard includes key Quality of Experience (QoE) metrics such as the average Time to First Frame (TTFF), which measures the elapsed time between when a user clicked play and when their video began. It also visualizes Rebuffer Ratios, which describe the portion of playback time a user spent waiting for a video to buffer. Monitoring and alerting on these QoE metrics can help you identify delays and interruptions in video playback that can reduce customer satisfaction and lead to churn.
The dashboard also comes with default template variables that enable you to dynamically filter your data. For instance, you can home in on specific browsers (with the browser_family variable) or playback sessions (with the content_session_id variable) to better understand the scope of an issue.
You can also customize your dashboard to track telemetry from other key components of your infrastructure. For instance, if you’re using Amazon DynamoDB to store video metadata, you can add widgets that visualize your table’s read and write latencies, as well as the number of throttled requests.
Correlate playback data with upstream service performance
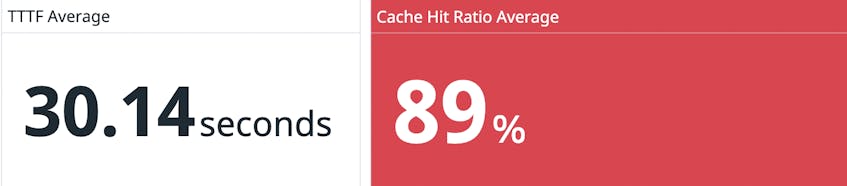
While playback performance metrics can tell you that an issue is occuring, they often can’t tell you why it’s occurring. In order to identify the cause, you also need visibility into your video workflow’s upstream services. Datazoom collects telemetry from CDNs like Akamai, Cloudfront, Fastly, and Lumen, which allows you to easily correlate video player and CDN performance. This way, if you are notified of a sudden TTFF spike, you can pivot seamlessly to CDN metrics such as Cache Hit Ratio, which compares the number of content requests your CDN’s cache filled successfully with the total number of requests it received. If your cache hit rate is lower than 95 percent, you may need to adjust your cache control settings.
You can also monitor playback performance alongside other upstream services. For instance, Datadog integrates with Amazon Simple Storage Service (S3), which is often used to store and package videos. When cache misses occur, CDNs will request data from your origin directly, which can increase latency. In order to mitigate this issue, it’s important to ensure you’ve sufficiently optimized your buckets with techniques such as parallelization.
Dive deeper into issues with standardized video workflow logs
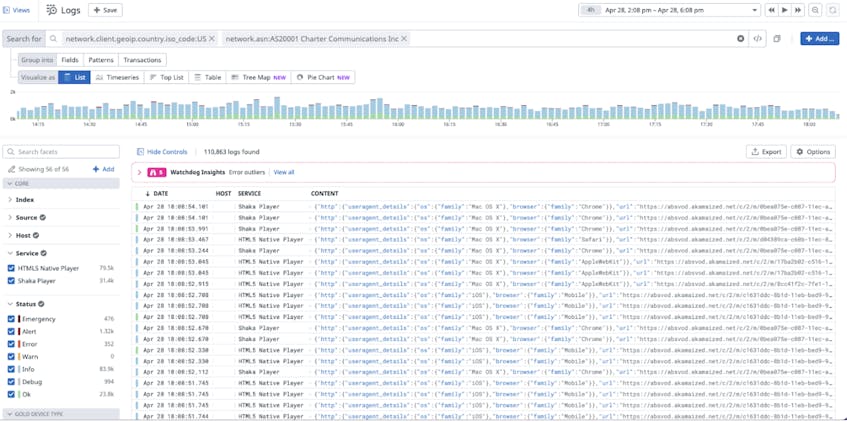
Datadog collects Datazoom logs, so you can get an in-depth look at events that occur at every point during your video streaming workflow. Datazoom logs are automatically enriched with tags, which provide contextual details about video workflow events that can help you investigate further. For example, if you’re notified of a low cache hit ratio, you can quickly filter your Datazoom logs by the associated CDN and region in which the issue occurred to accelerate your troubleshooting.
Start monitoring Datazoom video workflow data today
Datadog allows you to monitor Datazoom telemetry alongside more than 750 other services and technologies, providing you with an end-to-end view of your entire video workflow in a single, unified platform.
To learn more about how Datadog and Datazoom can help you deliver a high-quality user experience to your customers, check out our documentation. If you aren’t already using Datadog, get started today with a 14-day free trial.
