Nicholas Thomson

Konrad Janica

Rachel Groberman
Dataflow is a fully managed stream and batch processing service from Google Cloud that offers fast and simplified development for data-processing pipelines written using Apache Beam. Dataflow’s serverless approach removes the need to provision or manage the servers that run your applications, letting you focus on programming instead of managing server clusters. Dataflow also has a number of features that enable you to connect to different services. For example, Dataflow allows you to leverage the Vertex AI component to process data in your pipelines and then use Datastream to replicate Dataflow pipeline data into BigQuery.
With Datadog’s new Dataflow integration, you can monitor all aspects of your streaming application in the same platform. Datadog provides Recommended Monitors to help you stay on top of critical changes in your Dataflow pipelines. The out-of-the-box dashboard displays key Dataflow metrics and other complementary data—such as information about the GCE instances running your Dataflow workloads and Pub/Sub throughput—to give you comprehensive insights into your Dataflow pipelines.
In this post, we’ll highlight how Datadog’s Dataflow integration can help you:
- Monitor the state of your pipelines
- Get notified to critical changes in your pipelines
- Understand upstream and downstream dependencies

Monitor the state of your Dataflow pipelines
A Dataflow pipeline is a job composed of PCollections (dataset objects that Apache Beam uses as inputs and outputs) and PTransforms (operations that change the data into something more useful). With Datadog’s OOTB dashboard for Dataflow, you can monitor failures, long-running jobs, and data freshness analytics in a single pane of glass. The dashboard is divided into a few main sections that help you quickly get an overview of:
- Streaming metrics, such as maximum streaming data processed by job
- Standard metrics, including the current number of vCPUs, top PTransforms by throughput, and jobs with the highest processing duration
- Data freshness and latency metrics, which track backlogs in your system
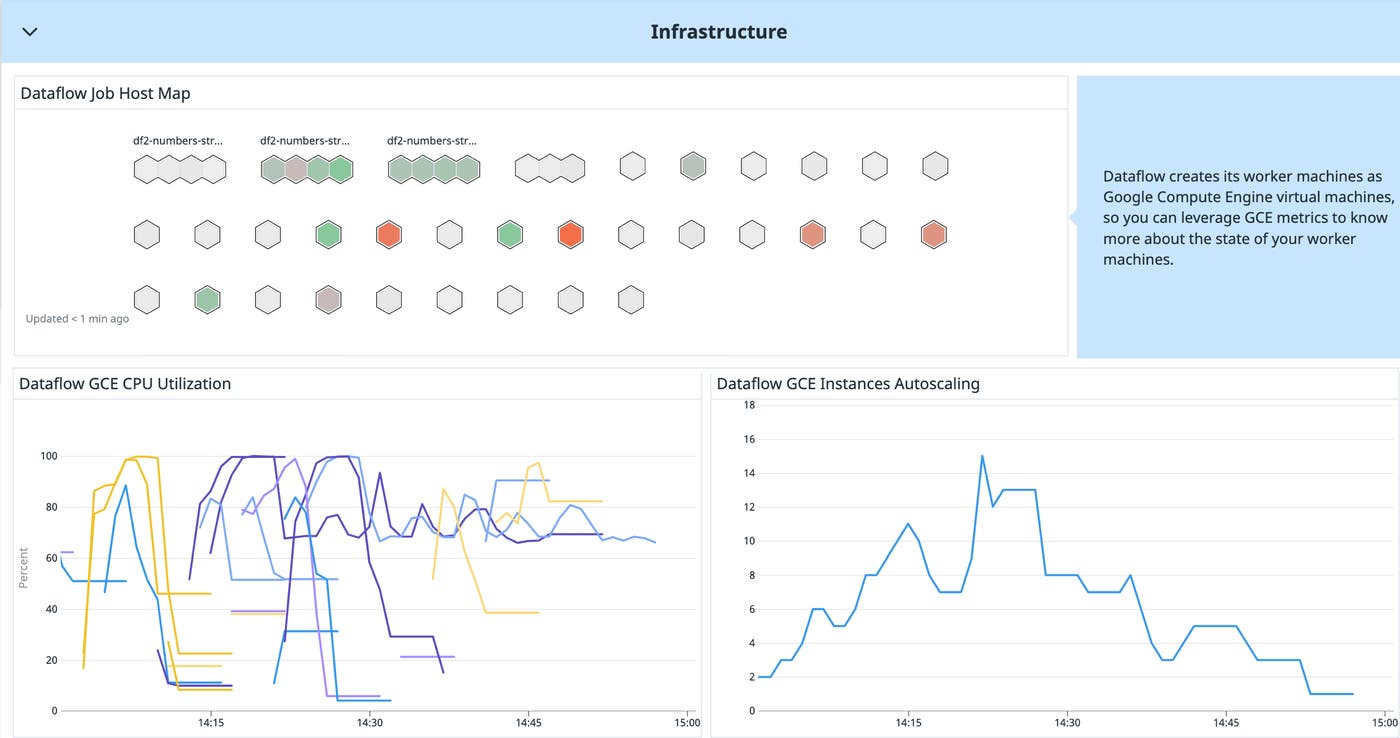
- Infrastructure metrics, which provide deep visibility into the Google Compute Engine virtual machines that are processing and storing your data
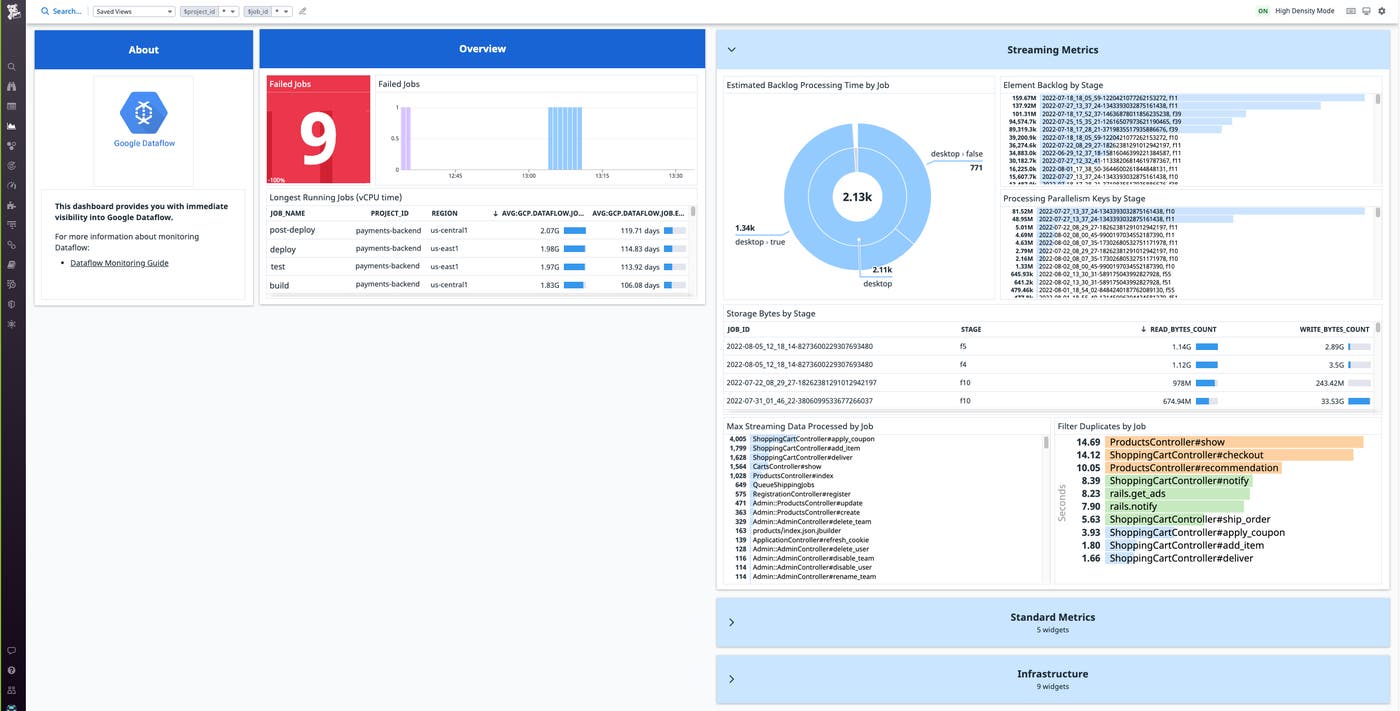
Dataflow metrics provide insights into the overall health and status of the multitude of pipelines that you’re running. For example, if you see a spike in system lag on a job, you can check the infrastructure section of the dashboard to make sure that your vCPUs are autoscaling properly.
If the problem isn’t with your infrastructure, then you may want to look into optimizing the transform functions used in that job. For instance, if your transform includes a ParDo with a high output, it might be a good idea to include a “fusion break” (Reshuffle.of()) to reduce latency.
Get notified to critical changes in your pipelines
For teams that rely on Dataflow, alerts can be a valuable way to stay on top of any issues that may arise in your pipelines, thereby improving efficiency, and reducing MTTR when it comes time to debug. With Datadog, you can create custom alerts to notify you when critical changes occur in your Dataflow pipelines. You can also leverage a preconfigured Recommended Monitor to detect an increase in backlog time in your pipeline, as shown below.
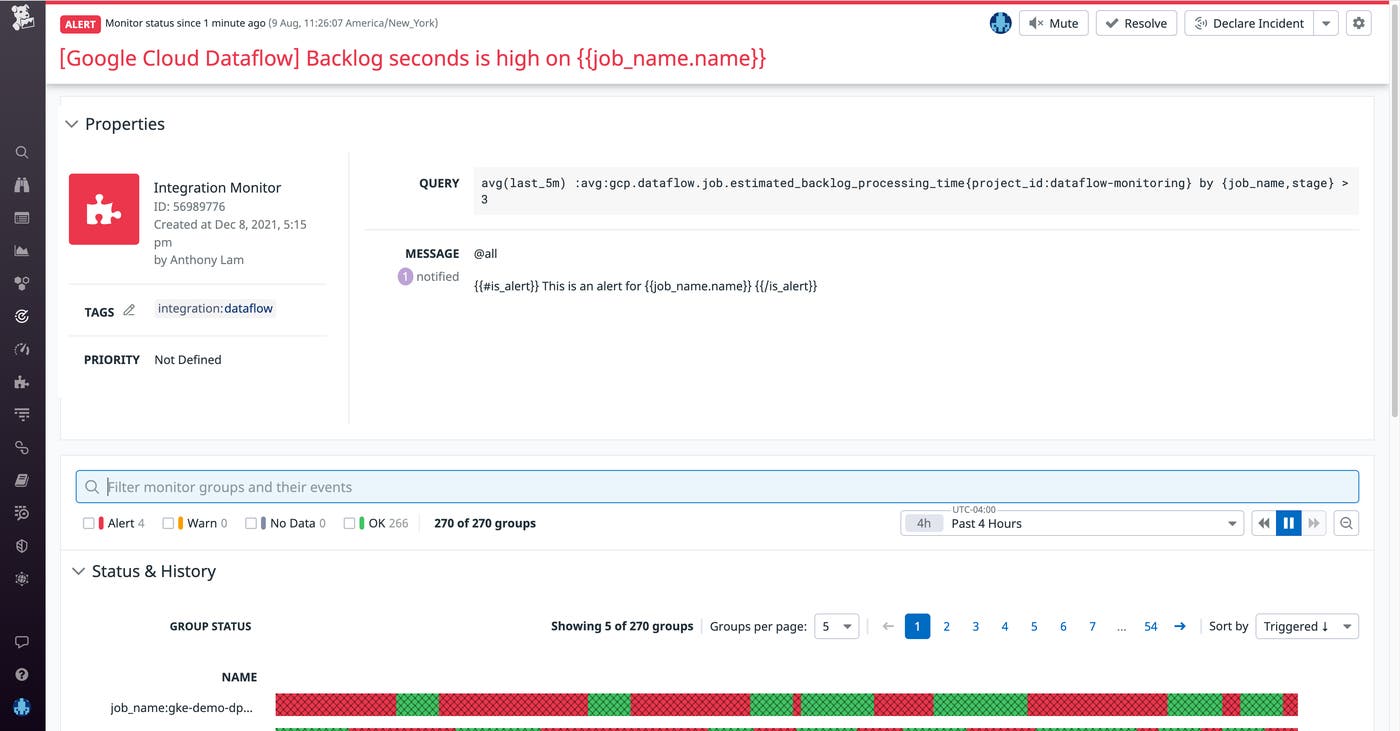
You can customize the notification message to include a link to your Dataflow dashboard, which shows you a timeseries detailing how your Dataflow pipelines have failed to process data from checkouts in your application.
To further investigate the root cause of the issue, you turn to the Dataflow logs, which can be sent to a Pub/Sub with an HTTP push forwarder. Upon digging into the logs, you find error messages from the problematic job: Some Cloud APIs need to be enabled for your project in order for Cloud Dataflow to run this job. With this information, you are able to deduce that you need to enable the BigQuery API in your application.
Understand upstream and downstream dependencies
Dataflow latency issues and job failures can sometimes be traced back to a problem in an upstream or downstream dependency. Because Datadog also integrates with other Google Cloud services that interact with your Dataflow pipelines, such as Compute Engine, Cloud Storage, Pub/Sub, and BigQuery, you can get complete visibility for investigating the root cause of issues like slow pipelines and failed jobs. So from the Dataflow dashboard, you can easily pivot to upstream or downstream dependencies, which are also monitored by Datadog.
For example, say you use Dataflow to read Pub/Sub messages and write them to Cloud Storage. If you notice an increase in Dataflow job failures, you might want to see if a Pub/Sub error is at the root of the issue. You check Datadog’s out-of-the-box Pub/Sub dashboard and find an elevated number of publish messages with the error response 429 rateLimitExceeded.
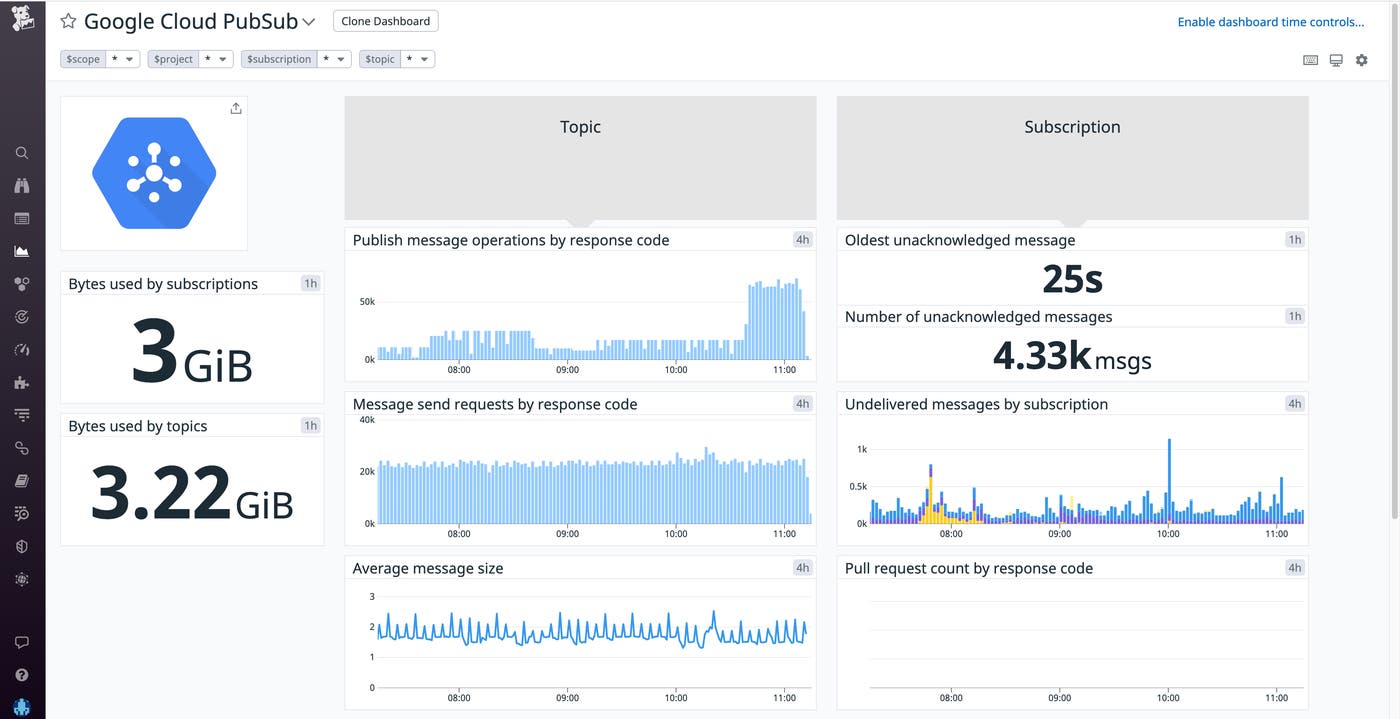
This may be caused by an insufficient Pub/Sub quota. To remedy this, you can manage your Pub/Sub quotas in Google Cloud.
Get started with monitoring Dataflow today
Datadog’s integration gives Dataflow users full visibility into the state of their pipelines, and lets them visualize and alert on the Dataflow metrics that matter most to their team.
“We manage several hundreds of concurrent Dataflow jobs,” said Hasmik Sarkezians, Engineering Fellow, ZoomInfo. “Datadog’s dashboards and monitors allow us to easily monitor all the jobs at scale in one place. And when we need to dig deeper into a particular job, we leverage the detailed troubleshooting tools in Dataflow such as Execution details, worker logs and job metrics to investigate and resolve the issues.”
Datadog also integrates with more than 1,000 other services and technologies, so teams can monitor their entire stack using one unified platform. For example, teams can use Datadog’s Google Cloud integration to monitor their GCE hosts in Datadog, or leverage the BigQuery integration to visualize query performance.
If you aren’t already using Datadog to monitor your infrastructure and applications, sign up for a 14-day free trial to start monitoring your Dataflow pipelines.

