

Containers are lightweight, portable, easily scalable, and enable you to run multiple workloads on the same host efficiently, particularly when using an orchestration platform like Kubernetes or Amazon ECS. But containers also introduce monitoring challenges. Containerized environments may comprise vast webs of distributed endpoints and dependencies that rely on complex network communication. Adding further complexity, you need to ensure that each node in your cluster maintains contact with almost every other node. And containers are highly ephemeral, which makes IP-level connection data unreliable for tracking network traffic between these components, especially in the cloud.
Datadog Network Performance Monitoring visualizes network traffic between objects within your entire containerized environment. This makes it easy to monitor network dependencies across all of your containers, services, and deployments so you can spot architectural and performance issues quickly. If you’re using a service mesh in your environment, Datadog NPM also enables you to analyze service mesh traffic to help identify traffic management misconfigurations and ensure the services in your mesh communicate efficiently.
In this post we’ll look at how you can use Datadog NPM to help you:
- visualize network communication across your dynamic containerized infrastructure
- troubleshoot performance issues in containerized applications
- analyze service mesh traffic health
Visualize your containerized architecture with the Network Map
Containerized environments are highly distributed and can quickly grow in size and complexity, making them especially vulnerable to network issues. And, because each service may have many dependencies, an isolated problem can have an outsize impact on the rest of your application. This means visibility into network communication across your containerized workloads is key to monitoring the health and performance of your applications. But because containers churn often, tracking communication between them can be difficult.
Datadog’s Network Map uses directional arrows, or edges, to visualize traffic flows between containers, pods, deployments, or other tagged objects in your environment, regardless of whether their constituent containers change. This gives you a real-time view of your network’s topology so you can spot architectural inefficiencies and misconfigurations. Visualizing traffic with edges can quickly reveal, for example, if Kubernetes pods in the same cluster are communicating through an ingress controller rather than directly to each other. Since you’d expect an ingress controller to be used for traffic between different clusters, intra-cluster ingress traffic indicates misconfiguration which can lead to increased latency.
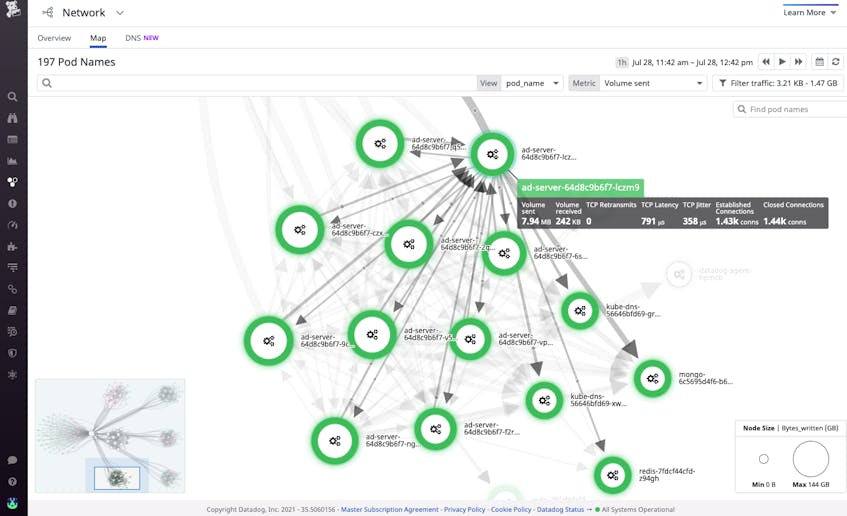
The Network Map’s visualization options enable you to tie issues like high TCP retransmits and latency to objects within your containerized infrastructure, like ECS tasks or Kubernetes deployments and pods. This enables you to determine at which layer of your environment network problems are occurring. Let’s say you use the Network Map to visualize the TCP latency across your services and see that there’s high latency between two services. You can inspect one of the services and then break the map down further by selecting pod_name in the View dropdown menu, enabling you to dig deeper by viewing latency in the context of your services’ underlying pods. This way, you can see if a particular pod is contributing to latency, indicated by thicker lines connected to a pod’s node.
Once you’ve identified a pod to investigate, you can view it in the Orchestration Center and see its specs (including status), resource consumption down to the process level, logs, and more. If the pod’s CPU usage is high, that is likely the culprit behind the latency you observed. Now that you’ve pinpointed the root cause, you can start taking mitigating steps to reduce latency, like scaling the pod.
Get full visibility into each layer of your containerized applications
In containerized environments, requests can propagate across a number of components in your infrastructure. Because of this, it can be difficult to determine whether problems are due to network issues or possible code-level bugs. For example, pod connectivity problems can manifest as application latency or errors if your service can’t reach a dependency.
Datadog APM provides insight into issues at the application layer of your containerized environment in order to help determine the root cause of a problem. For instance, if you’ve identified a container running on EC2 that’s experiencing high request latency, you can dig into its traces to try to establish whether the cause is a code-level issue. If not, you can then easily pivot to the “Network” tab to view all network connections that are related to that service and identify if the problem stems from an upstream service (i.e., one application’s pods are overwhelmed with traffic from another application and can no longer respond to requests).
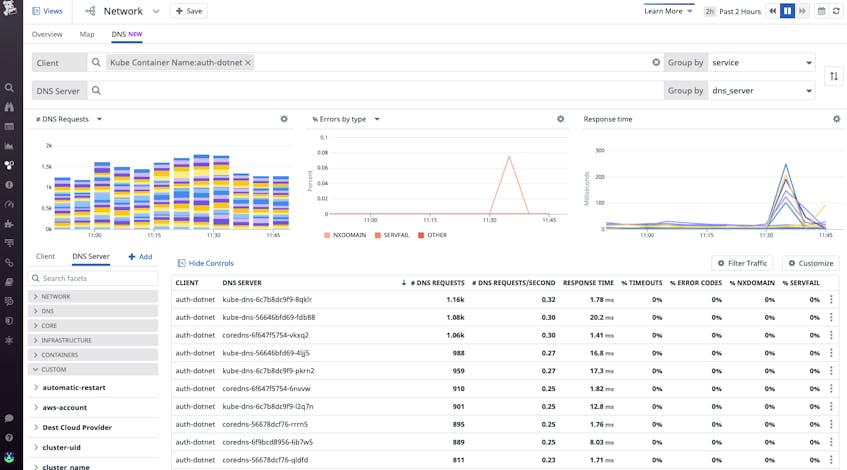
Datadog NPM also supports DNS monitoring, which means you can view the health of the communication between your pods and DNS servers to determine if a service discovery issue is preventing your client pod from finding the pods it needs to reach. You can easily identify which DNS servers (such as CoreDNS pods) may be contributing to the high response time or error rate of incoming DNS requests. Or, you can look for spikes in NXDOMAIN DNS responses. This can help determine whether a DNS server’s latency is a consequence of a client-side issue, like a pod making multiple invalid requests for every valid request, which may be overloading the DNS server.
Analyze service mesh and proxied traffic health
Service meshes like Istio help manage the access parameters and routing of microservice communication. But they also introduce further monitoring challenges by adding a layer of abstraction across your environment, making it challenging to get visibility into container communication. With Datadog Network Performance Monitoring, you can easily visualize traffic flow across Istio-managed networks. And, Datadog’s Istio integration provides full visibility into every other aspect of your Istio environment. Datadog collects key Istio metrics to monitor bandwidth and request performance, logs to investigate control plane health, and distributed traces from application requests propagating across your mesh.
Additionally, Datadog supports Envoy monitoring, enabling you to easily correlate Istio monitoring data with data from its Envoy proxy mesh. Because application containers route traffic through Envoy sidecars installed on their local pods to sidecars on separate pods, latency between pods could either be due to latency between application containers and their local Envoy sidecar or to latency between sidecars themselves. Datadog NPM tags Envoy sidecars as containers, which means if you do see latency between pods, you can use the Network Map to visualize the underlying container traffic and determine if it’s a service mesh issue.

Start monitoring your containerized workloads with NPM today
Whether you’re using orchestration tools like Kubernetes and Amazon ECS, relying on an Istio service mesh, or migrating to any of these platforms, Datadog Network Performance Monitoring provides you with full visibility into your containerized applications and their communication. To get started with NPM, follow the installation instructions here. And, to learn about how Delivery Hero was able to safely scale to meet 2X their orders in 2020 using Datadog NPM for visibility into their Kubernetes network, see the case study.
If you’re new to Datadog, sign up today for a 14-day free trial.
