Evan Mouzakitis
Consul is a distributed configuration and service-discovery tool which is datacenter-aware and architected to be highly available.
When used as a service-discovery tool, Consul clients can register a service (e.g. MySQL, Redis, RabbitMQ) and other clients can use Consul to discover those services dynamically. This ability to react to real-time changes in service availability and route requests to appropriate instances of a service allows your applications to scale more easily, and continue working in the face of failures.
Consul is based on a distributed client-server architecture. Servers, in Consul parlance, are referred to as “peers” and clients are called “nodes.” Peers in the server pool hold elections to choose a leader when one is not present, or there is significant latency between the leader and the rest of the peers.
Requests from nodes are all served by the leader, and any changes made on the leader are then replicated to the other peers. Consul is built on top of the Raft consensus algorithm, providing fault-tolerance with strong data consistency. (If you’re interested in the geeky details of how Raft works, here is a great visual description.)
By activating the integration within Datadog, you can monitor Consul health and availability of services across your cluster.

Health checks
Arguably one of Consul’s most useful features is its built-in health checks. Consul offers both service health checks and node health checks.
Node checks (aka host checks) are done on the individual host level; if a node fails a node check, all services on that host are also marked as being in a failure state and Consul no longer returns the node in service discovery requests.
A service check is more targeted—failure will not place the entire node in a failed state, only the particular service being checked. This is important if you are running more than one service per host. For example, consider an environment in which NGINX and MySQL are hosted on the same box. If you have registered a service check to query the NGINX instance, should NGINX go down for some reason the node will still be able to serve MySQL requests. However, if the NGINX health check was a node check, a failure of NGINX would flag the entire host as unhealthy, regardless of any healthy services it may be running.
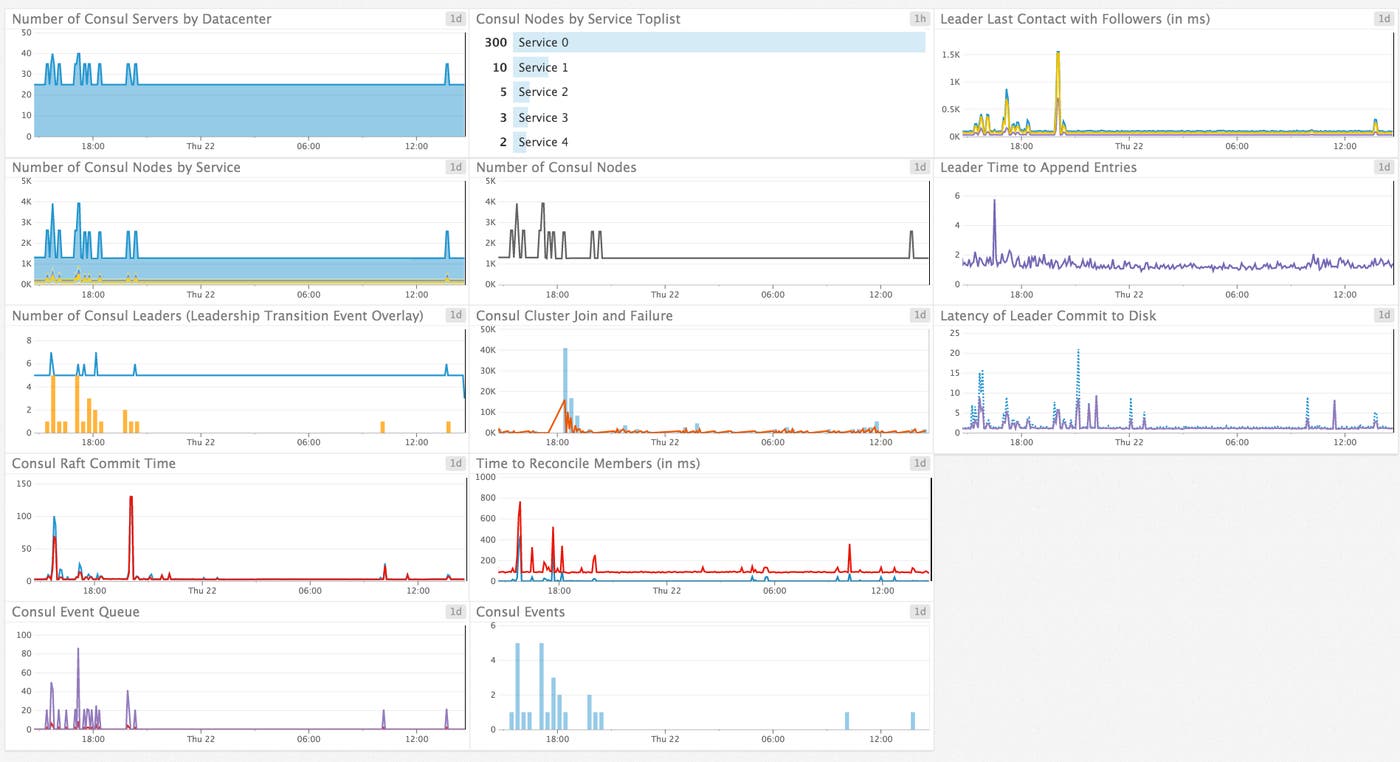
Once you’ve registered a health check, the Datadog Agent will automatically tag each service-level check with the service name (whatever name is given in the check itself), allowing you to monitor group membership at the service level. Each tag is prefixed with consul_service_id: followed by the name of the service (e.g. consul_service_id:redis, consul_service_id:cassandra). The default dashboard should automagically create a graph for you with your number of available nodes grouped by service.

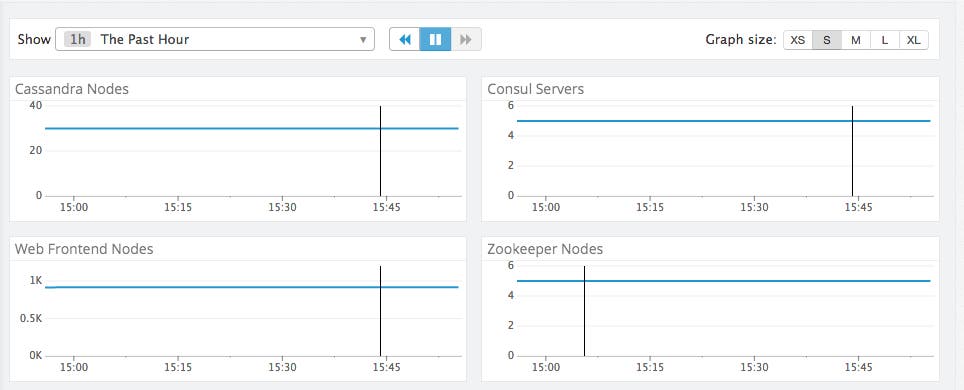
If you are running more than about five services, the default graph may have too much information on it; you can break out each service into its own graph to give yourself a clearer view, like the graphs below. Note that it is not uncommon to have flat-line graphs as pictured in these examples; these graphs show a constant number of nodes providing each service.

Latency
You can inspect latency between the leader and its followers via the following metrics in Datadog:
consul.raft.leader.lastContact.maxconsul.raft.leader.lastContact.avgconsul.raft.leader.lastContact.95percentile

Because all requests are routed through the leader, an increase in leader latency means a system-wide slowdown in processing requests. You may want to receive an alert if your average latency exceeds a certain threshold.
Additional latency metrics are available on a per-peer basis following the consul.raft.replication.heartbeat.<HostNameOfNode> pattern. These metrics give you the latency between the specific peer and current leader.
In addition to the above network latency metrics, a few disk latency metrics are also available. All write requests to Consul require that a majority of servers commit a change before responding to a client request. If quorum is satisfied, the leader modifies the data and returns the result to the requester.
Two metrics are useful in tracking commit latency: the time it takes to commit on the leader and the time taken to replicate to followers: consul.raft.commitTime and consul.raft.replication.appendEntries, respectively. Additional latency information is contained in consul.raft.leader.dispatchLog.avg and consul.raft.leader.dispatchLog.max; these metrics record the average and maximum times for the leader to commit the log to disk. Long commit times are treated similarly to long response times—either condition can trigger an election for a new leader.
Cluster health
Nodes can leave the cluster in one of two ways—either they depart gracefully, or are not heard from and are thus reaped. Excessive node failures could signal a network partition or other event, and are worthwhile to monitor. In the default dashboard, node failures are graphed alongside successful node joins.

You’ll also have metrics on:
- Current number of Consul servers (peers)
- Leader reconciliation times (the time it takes for the leader to bring its peers up-to-date)
- New leader events
Events
Consul’s event feature provides a mechanism by which custom events can be propagated across your entire datacenter. Events offer a way to automate deploys, restart services, or perform any number of orchestration actions. Combined with Consul’s watch feature, events can be a powerful tool in your automation arsenal. Although Consul’s own documentation states that there are no guarantees of event message delivery, in practice delivery seems to be very reliable (scroll past the gist).
If you are using Consul’s event feature, you want to monitor the number of events sent using consul.serf.events, as well as the backlog of events in the queue, using consul.serf.queue.Events.avg and consul.serf.queue.Events.max.
Note: You should expect some of these metrics to be fairly flat. For instance, the consul.peers metric should be relatively stagnant—for most use cases, addition or removal of Consul servers (peers) should be an infrequent occurrence.
Tagging
Tagging is essential for a scalable monitoring solution, so in addition to your custom tags, all of a node’s metrics contain information on its physical location with the consul_datacenter tag. This tag is invaluable when managing a large Consul deployment across different locations.
Two additional tags are available on specific metrics. The mode:leader or mode:follower tag is present on the consul.peers metric and tells you which peer is the leader and which are followers. The consul_service_id tag is present on the consul.catalog.nodes_up metric, giving you information on the number of nodes for each service.
Alerts
For most use cases with a stable Consul cluster, many of the available metrics will appear relatively flat. In those cases, additional monitoring may prove to be invaluable. Datadog enables you to create custom alerts based on fixed or dynamic metric thresholds. For example, in a small Consul cluster of three peers, should one peer fail, all fault tolerance capabilities are lost. An alert on the consul.peers metric can notify you to take action, such as manually provisioning a new peer.
Monitor Consul
If you already use Datadog, you can monitor Consul with four steps:
-
If you haven’t already done so, install the Datadog Agent on your Consul hosts.
-
Configure the Datadog Consul integration. Copy conf.yaml.example to /etc/datadog-agent/conf.d/consul.d/conf.yaml. (This is the Datadog configuration directory on Linux systems. For other platforms, check our documentation.) If Consul is running on a non-default port, edit the
urlsetting accordingly. -
Restart the Datadog Agent to load your new configuration. The restart command varies somewhat by platform; see the specific commands for your platform here.
-
Enable the Consul integration to get all your metrics in Datadog.
You can optionally collect metrics about Consul’s internal behavior by configuring Consul to send its telemetry data directly to the Datadog Agent’s DogStatsD server.
Open or create a Consul configuration file (the location will be specified with the -config-file or -config-dir options of the consul agent command). In your configuration file, add a top-level "telemetry" key with your "dogstatsd_addr" nested under it (see snippet below). Once you reload the Consul agent, it will begin sending its metrics over UDP to port 8125, which is where the Datadog Agent’s DogStatsD daemon will be listening.
{[...] "telemetry": { "dogstatsd_addr": "127.0.0.1:8125" },[...]}To extract tags from the metrics Consul sends to Datadog, open the integration configuration file you edited earlier and add rules for Datadog’s DogStatsD Mapper, following the guide in our documentation.
If you are new to Datadog, try it out today with a free trial.
Acknowledgments
Thanks to Armon Dadgar, CTO of HashiCorp, for his technical assistance with this article.


