

Cilium is an open source technology that delivers network security to large-scale containerized environments at the packet and application levels. Cilium integrates easily with your Kubernetes clusters, either self-managed or managed services (e.g., Amazon EKS, Google GKE, and Microsoft AKS). You can also deploy Cilium to Docker environments using Mesos.
Traditional firewalls filter traffic based on IP address and port. However, in dynamic containerized infrastructures, these parameters are constantly changing as hosts churn. Cilium overcomes this with low performance overhead by using the Linux kernel’s Berkeley Packet Filter (BPF) to transparently enforce security policies using container identities or abstractions like Kubernetes service or pod. It also provides security at the application layer by filtering requests using common protocols, such as HTTP, gRPC, and Kafka.
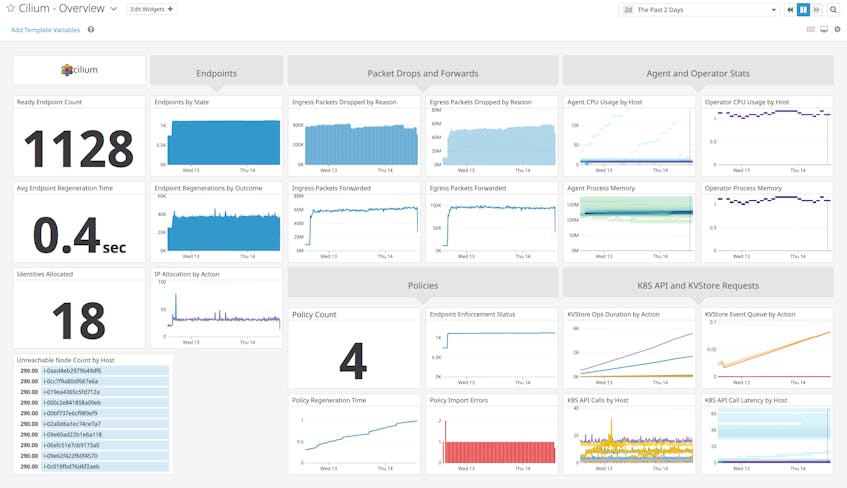
We’re pleased to announce that Datadog now integrates with Cilium to help you ensure your network policies are properly deployed and enforced so that your microservices stay protected from attacks. Once you’ve enabled the integration, you can easily visualize and alert on key metrics exposed by the Cilium Agent and Operator—such as endpoint regeneration, packet flow, and policy import errors—in an out-of-the-box dashboard.
Track endpoint health and lifecycle events
Cilium refers to a group of one or more containers that shares a common IP address—such as a Kubernetes pod—as an endpoint. Cilium resolves each endpoint’s identity based on its labels, which are key-value pairs that Cilium automatically pulls from sources such as the container runtime and orchestration system. The Cilium Agents that sit on each node use these identities to enforce security policies that establish which endpoints are allowed to communicate with each other.
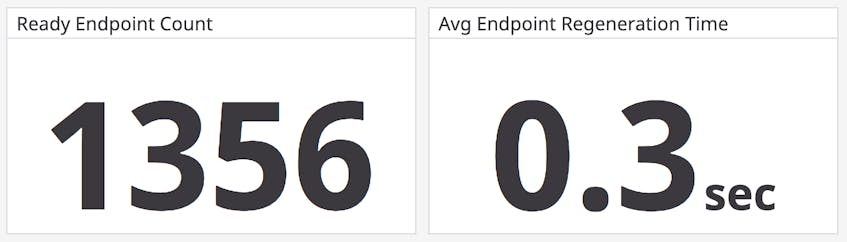
Containerized infrastructures are highly dynamic, with containers regularly created and destroyed, so endpoints tend to have a relatively short life span. Our integration gives you a high-level view of endpoint health and lifecycle events to help you track how many endpoints are up and running. If you find that traffic you want to block is getting through, or vice versa, it means that your policies are not properly enforced. This could indicate that Cilium is not managing all of the containers that should fall under those policies. For instance, Cilium does not apply security policies retroactively, so any containers that were created before you deployed Cilium would not be covered.
To troubleshoot, compare the number of endpoints (cilium.endpoint.state) on a specific node to the number of pods running on that node. This tells you how many pods are currently not controlled by Cilium. If you’re running Kubernetes, you can run the ./contrib/k8s/k8s-unmanaged.sh script in your cilium directory to identify these specific pods. This reveals the weak spots in your security infrastructure where you should focus your efforts. For example, you might need to redeploy those older pods so that they fall under the security policy.
Monitor endpoint regeneration duration
A change in network configuration or endpoint identity causes the security policy being enforced on the endpoints to also change. When this happens, Cilium regenerates the relevant endpoints to update their BPF configuration. This is reflected by a change in the endpoint’s state to waiting-to-regenerate or regenerating. Since it is important for your network to enforce the most up-to-date policy rules, you should monitor the duration of regeneration events (cilium.endpoint.regeneration_time_stats.seconds.count), particularly as your cluster scales, to ensure that they are completed in a timely manner.
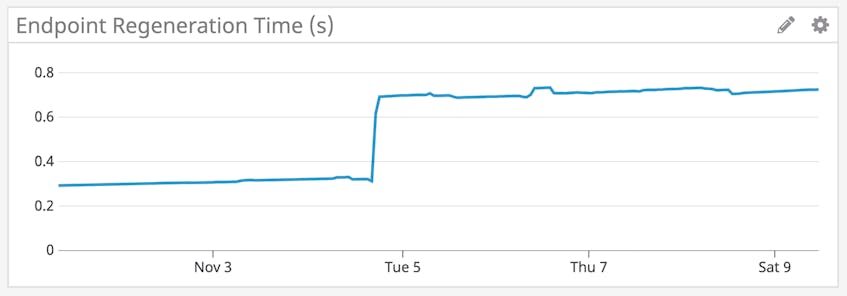
A sudden spike in endpoint regeneration time could indicate that Cilium is unable to keep up with your environment’s container churn rate. Use dashboards to correlate endpoint regeneration time with the CPU and memory usage of your Cilium Agents (which run on each node in your cluster) and Operator (which runs at the cluster level), as well as Docker or Kubernetes metrics that track, for example, the number of pending containers. This can help you effectively troubleshoot and determine if you need to provision more resources to your nodes so that Cilium is able to scale with your cluster.
Know when packets are dropped
Policies are the rule sets that the Cilium Agents use to determine what traffic is allowed to and from the node while dropping the rest. Each rule contains an ingress section, which has the rules that need to be applied to traffic entering an endpoint, and an egress section, which specifies the rules that must be applied to traffic leaving the endpoint.
Our out-of-the-box dashboard provides visibility into how Cilium is controlling traffic across the cluster with graphs that track how many incoming and outgoing packets are forwarded or dropped. If you observe an unusual spike in dropped packets (cilium.drop_count.total), it could, for example, indicate either a service attack or a policy misconfiguration where legitimate access attempts are erroneously classified as illegitimate.
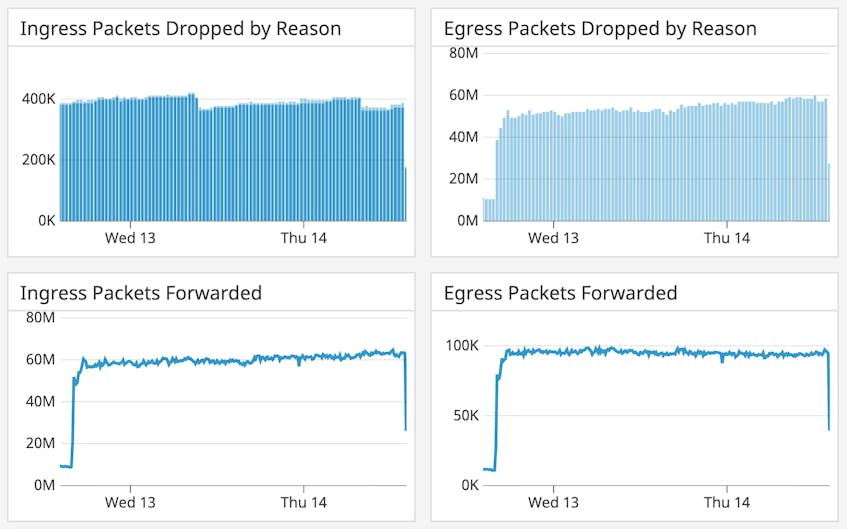
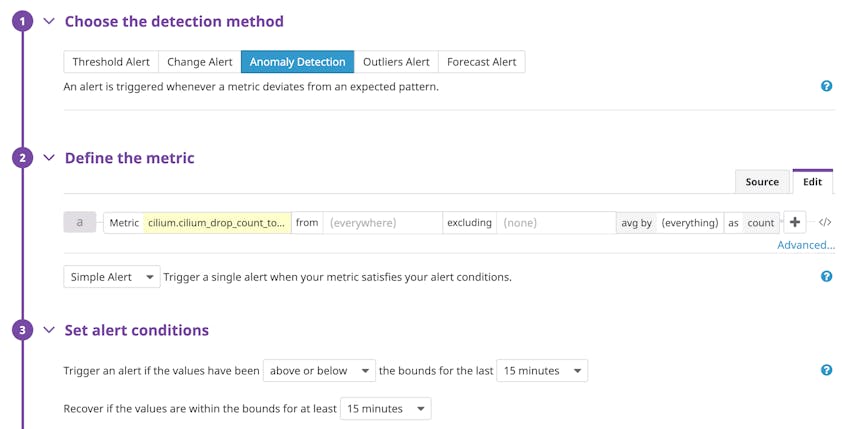
Cilium labels dropped packets with whether they are in- or outbound and the reason they were dropped, such as a denied policy or an unroutable IP address. Datadog automatically pulls in these labels as tags and applies them to your metrics. This lets you easily filter your graph to identify the cause of the spike and troubleshoot issues with your current policy enforcement. You can also set up an anomaly alert to notify your security team when there is an unexpected change in the flow of packets that warrants further investigation.
Detect issues with policy imports
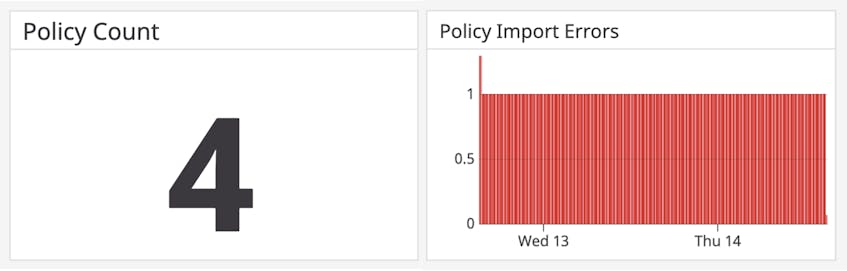
Ensuring that the right number of policies is enforced is crucial to avoid gaps in your security implementation. If you have a semantic error in your policy rule configuration, Cilium will not be able to validate the rule and will simply ignore it.
Therefore, if you find that fewer policies are loaded (cilium.policy.count) than expected, you can troubleshoot by verifying which policy rules are currently being applied to an endpoint. Like endpoints, policy rules are identified by labels. Running the command cilium endpoint get <endpoint identifier> inside one of your Cilium Agent pods generates a list of labels for every rule that corresponds to the specified endpoint. You can then use these labels with cilium policy get <labels> to retrieve a list of policies that Cilium is enforcing for that endpoint. This can help you determine whether a policy is missing so you can correct the policy definition if it was due to an import error.
Securing your containers made easy
With Datadog, you can get deep visibility into the way Cilium enforces network security policies across your container environments, alongside more than 750 other technologies that you might also be running. If you’re already using Datadog, check out our documentation to learn more about how you can set up the integration and start monitoring Cilium right away. Otherwise, you can sign up for a 14-day free trial.
