


Paul Gottschling
With continuous integration becoming standard practice, getting full visibility into your CI pipelines has become a key part of monitoring and troubleshooting. Datadog gives you that visibility with out-of-the-box support for several continuous integration tools, including:
Monitoring your CI servers can help you identify bottlenecks in your pipelines. And correlating CI activity with application performance metrics can help you pinpoint deployments that have degraded performance.
Your jobs, done on time
Your CI pipelines might be running jobs throughout the day. If jobs are slow or, worse, error-prone, you’ll risk your ability to maintain both a rapid release cycle and a highly available application.
Datadog’s integrations with popular CI tools make it straightforward to watch for problems with any of your pipelines. The Datadog Jenkins plugin, for instance, lets you pull tags from your pipeline to track duration by job, bringing sluggish jobs to light quickly. And with our GitLab integration (including GitLab Runner), you can tap into GitLab’s Prometheus metrics endpoint to see whether pipeline performance issues have to do with the way your CI servers use resources, from memory management to Docker container creation.
Since Datadog retains metrics at full granularity for 15 months, you can monitor job duration over time to see how changes in your CI workflow—more frequent commits, new automation stages—have affected performance.
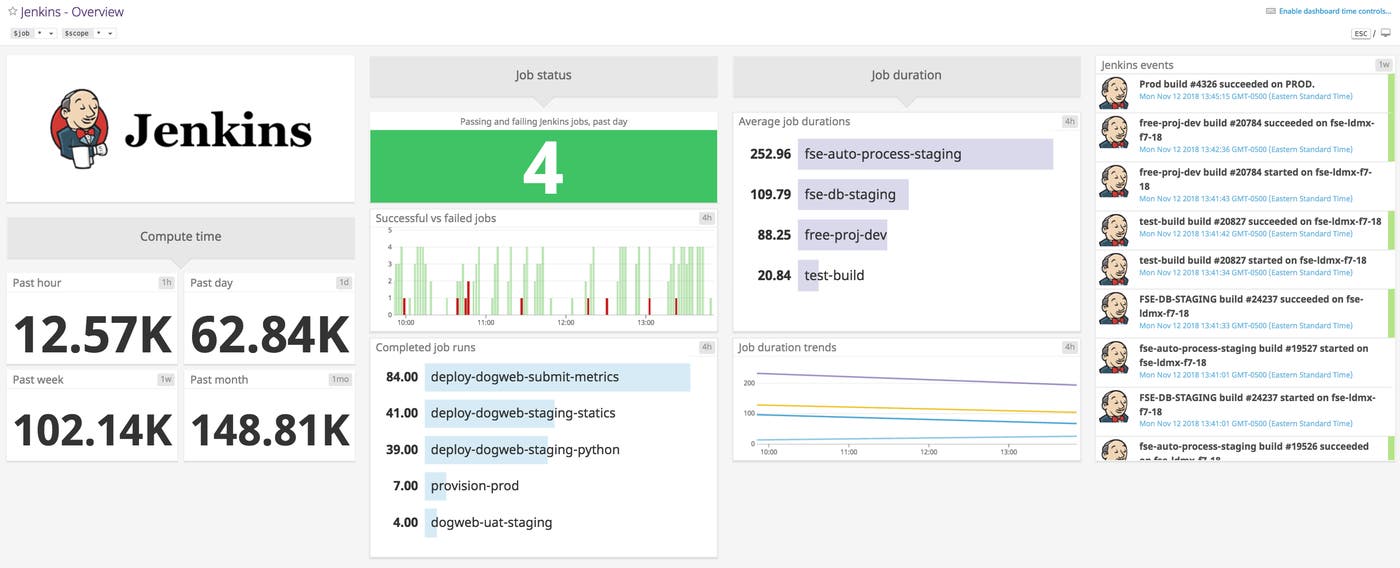
As you’ll see in the screenshot below, our out-of-the-box dashboard for Jenkins shows you a ranking of jobs by duration, as well as recent trends in your duration metrics. Datadog’s drag-and-drop dashboards let you visualize data from your own CI infrastructure, combining system metrics from your CI servers with status metrics or events from your pipelines.
Troubleshoot with deployment info
If your application is showing more errors than usual, or your hosts start consuming more resources, a recent deployment may be to blame. Datadog can help you determine how your build cycles contribute to issues by making it straightforward to compare events in your CI pipelines with trends in metrics, logs, or request traces. Our TeamCity integration reports builds and deploys as events, for instance, and our integrations with CircleCI and Travis CI report counts of builds as metrics that you can easily correlate with application-level anomalies.
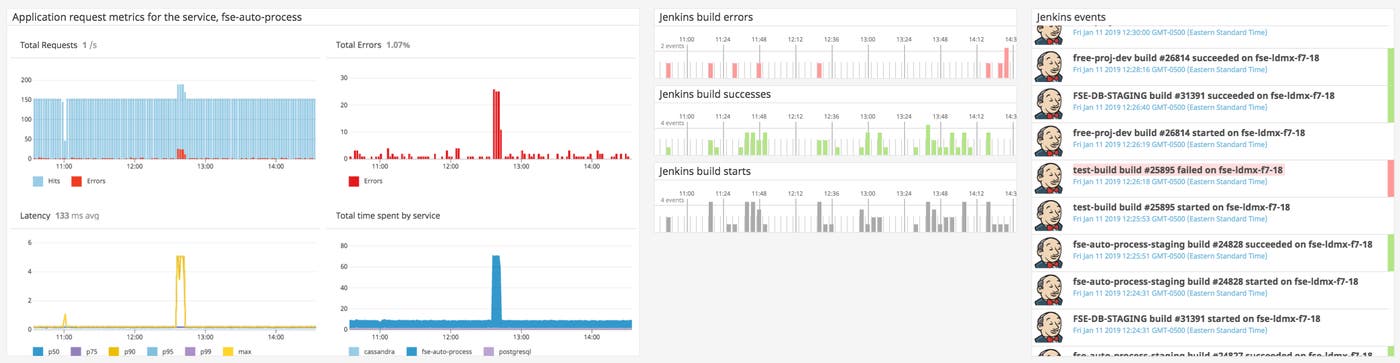
After noticing the spike in errors and request latency in the dashboard below, for example, we can see whether there is an accompanying set of build events, and inspect specific event messages for indications of a root cause.
Alert by job
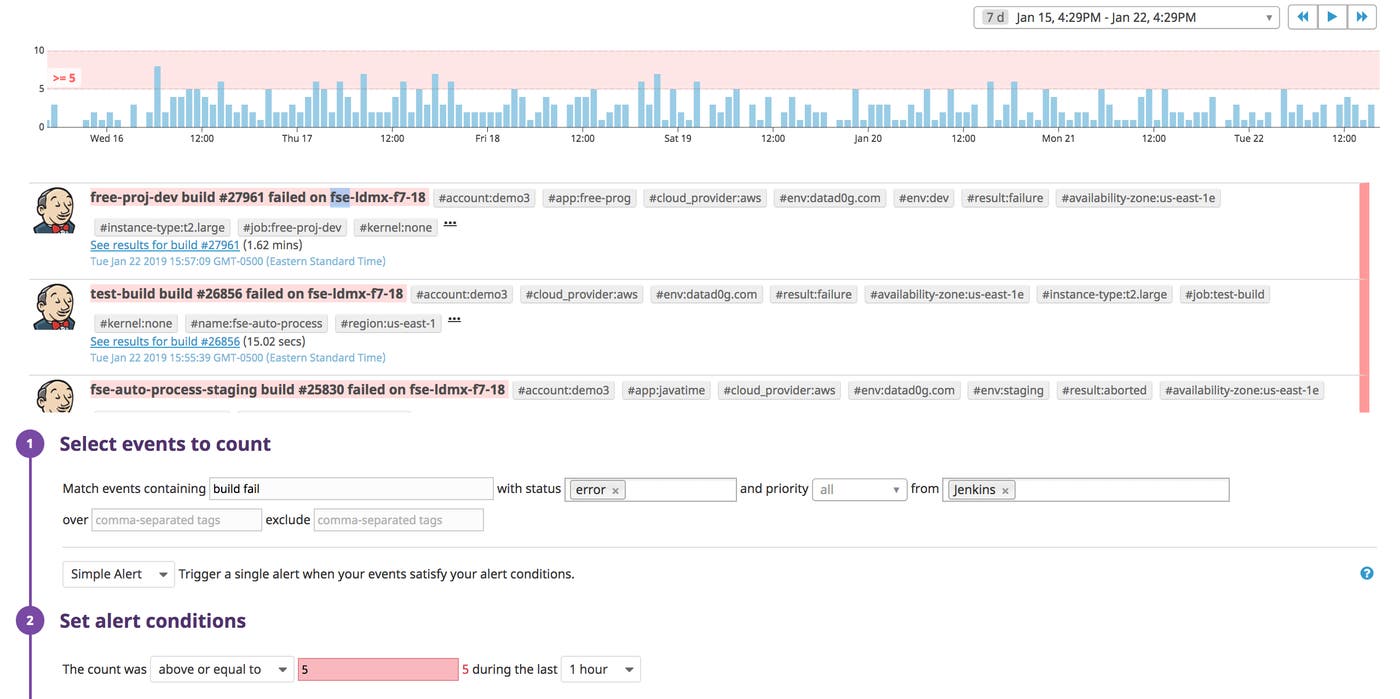
You’ll want to notify your team if your CI pipelines start to show worrisome trends, such as an unexpected decline in the count of completed builds during a period that is often busy for your CI system. Datadog makes it possible to alert on any sort of information your CI infrastructure produces, including both metrics and events. For example, you can alert on a specific frequency of error events in a certain period (as shown below).
Monitor any CI server
Integrating Datadog with your CI tool of choice takes just a few steps. For CircleCI and Travis CI, add account details to the relevant integration tile, including an API key that Datadog can use to access your CI server. For Jenkins, install a Datadog plugin. For Azure DevOps, configure service hooks to automatically trigger when selected types of events occur—and send those events and metrics to Datadog. GitLab and TeamCity are built into the Datadog Agent—all you need to do is add server and user details to a configuration file. The Agent will then start collecting operational data like metrics, tags, and events from your CI pipelines.
Continuous Datadog integration
You can now use Datadog with GitLab, Jenkins, Travis CI, CircleCI, TeamCity, and Azure DevOps, giving you full visibility no matter which CI tool is deploying your code. If you’d like to start using Datadog to monitor your pipelines along with over 1,000 vendor-supported integrations, sign up for a two-week, full-featured free trial today.


