

Ceph is an open source, distributed object store and file system designed for scalability, reliability, and performance. It provides an S3- and Openstack Swift–compatible API for storing, retrieving, and managing objects.
Ceph has native CLI tools that can check the health of a running cluster. But if you rely on Ceph in production, you will need dedicated monitoring to provide historical and infrastructure-wide context. Using Datadog you can correlate Ceph’s throughput and latency with traffic and the operations of any other system or application components in your infrastructure, helping you pinpoint performance bottlenecks and provision resources appropriately.
This blog post covers some of the most important aspects of monitoring and investigating Ceph’s operations and performance with Datadog.
Monitor Ceph performance at any level of granularity
Cluster-wide metrics at a glance
A Ceph cluster often runs on tens or even hundreds of nodes. When operating high-scale, distributed systems like this, you usually care more about the cluster-wide system performance than a particular node’s downtime.
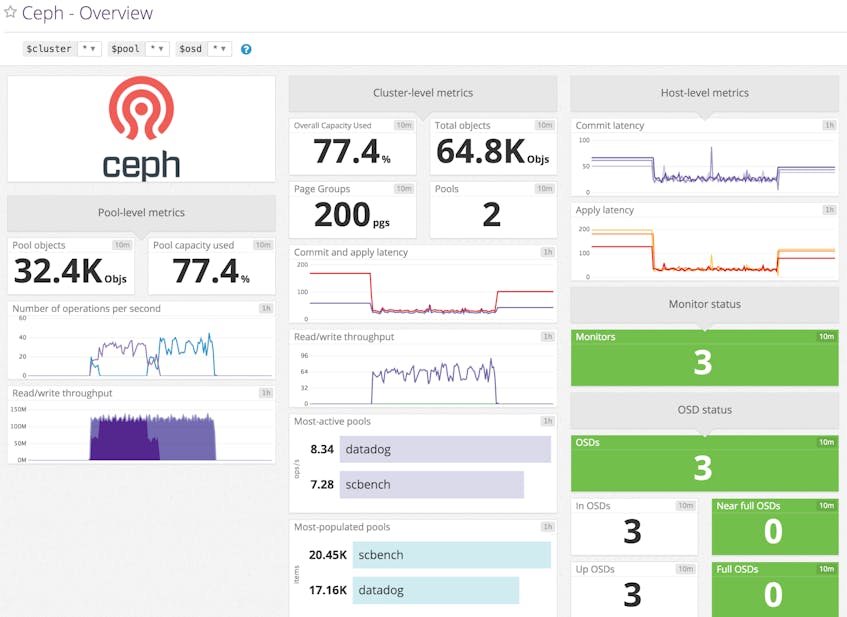
Datadog gathers cluster-level metrics such as capacity usage, throughput, and more at a glance. If you use more than one cluster, you can easily zero in on one particular cluster by changing the cluster template variable at the top-left corner of the screenboard. This instant filtering is possible due to metric tagging, the importance of which we covered deeply in another post.
Zoom into the pool
Ceph breaks the cluster into units called pools, to better organize millions or billions of objects stored in the distributed system. Different pools are typically used for different purposes, and may be replicated and distributed using different strategies. Some pools are used for storing user authentication information, for example, thus geographically distributed replication across SSD devices may be required for extremely fast and reliable retrieval. Other pools in the same cluster might be used for archived logs, and that data may need just one replica and can be stored on slower but economical devices like magnetic disks.
Instead of simply aggregating metrics from those divergent uses together, Datadog provides read/write throughput, capacity usage, and number of objects stored with pool-level resolution. You can leverage this feature to gather details about each pool’s usage pattern and quickly spot overloaded pools to tune the application for better performance.
Know each node’s status
In a Ceph cluster, Monitor nodes are responsible for maintaining the cluster map, and Object Storage Daemons (OSDs) reside on data nodes and provide storage services for Ceph clients over the network. Datadog’s built-in, customizable Ceph dashboard displays the aggregated status of each node type for a high-level view of cluster health.
Avoid Monitor-quorum deadlock
Your production Ceph cluster is likely deployed with more than one Monitor node for increased reliability and availability. For a Ceph cluster to function properly, at least 51 percent of all available Monitors need to be reachable. If the number falls below this threshold, Ceph will end up in a deadlock.
Datadog can alert you if you lose Monitors and are in danger of hitting this threshold so that you can either deploy more Monitor nodes or repair and bring the existing Monitor nodes back up again before your cluster suffers a service outage.
Constantly “down but in” OSDs
Usually, when an OSD is down, it will be automatically marked out by Ceph, and replication is triggered to copy its data to other nodes. This process may take up to 10 minutes. Under some conditions, however, OSDs may be down, but remain in the cluster. It is very likely that Ceph is experiencing some difficulty in recovering from the node loss and manual intervention might be needed. If this happens Datadog can inform you quickly so you can investigate and save the cluster from experiencing degraded performance.
Full and near-full OSDs
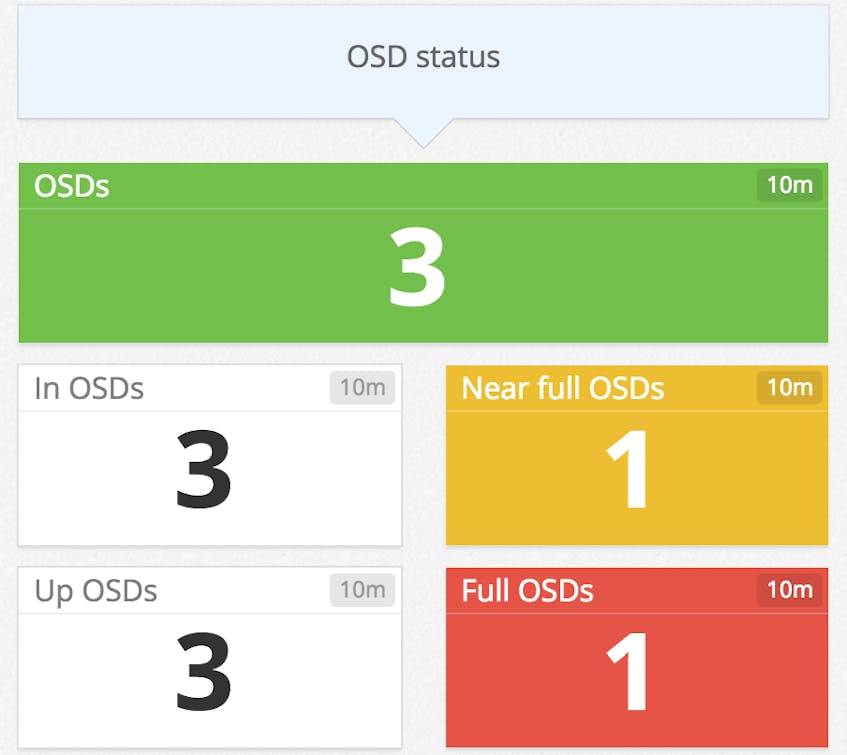
To ensure objects are evenly distributed across OSDs, Ceph recommends a minimum number of placement groups. If the balance between the number of OSDs, placement groups, and replicas is broken, either by a sudden change in the available nodes or misconfigured CRUSH map rules, some OSDs may be filled with objects before the overall cluster reaches its full capacity.
Datadog helps you to monitor the storage capacity at every level, including at the node level. So if any of the OSDs are full or nearly full, you can see that immediately on the dashboard.
Watch your apply and commit latency
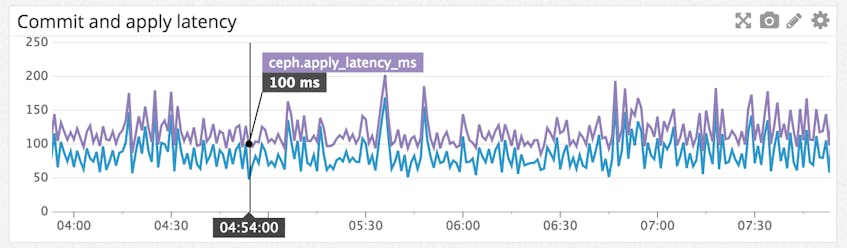
If caching is enabled, Ceph doesn’t write all updates directly to disk. This speeds up the transaction, but introduces an extra step before data is permanently stored. A transaction is usually marked complete after the operation is successfully committed to the journal—the time required for this step is reported as “commit latency”. The time required to flush the operation to disk is reported as “apply latency." It is important to keep an eye on both latencies to ensure that your system is performing quickly enough and is sufficiently robust to data loss, should a node go down before data is written to disk.
Getting started
If you are already using Datadog, you can start monitoring Ceph in minutes. If you are not a Datadog user yet, sign up for a full-featured trial account here to get started.
