John Matson
Azure Logic Apps lets you connect different Azure services and other software-as-a-service (SaaS) products, so you can automate your responses to events. For instance, you can send an email whenever you add a new customer to Salesforce, or post to Slack when a new GitHub issue is opened in one of your repositories.
If you’re building critical workflows in Azure Logic Apps, you want to ensure that your tasks are executing as expected. So we’re pleased to announce that you can now monitor all your Logic Apps with Datadog.
Workflow management in the Azure cloud
Logic Apps falls somewhere on the spectrum between simple integration services like IFTTT and open-ended code execution platforms such as Amazon’s Lambda or Azure Functions. Like IFTTT, Logic Apps has a visual interface that lets you build workflows from a library of pre-built connectors. But Logic Apps offers more developer-focused features, such as configurable retry logic and error handling, as well as the ability to add custom processing steps, such as XML validation or transformation.
Monitor your automation
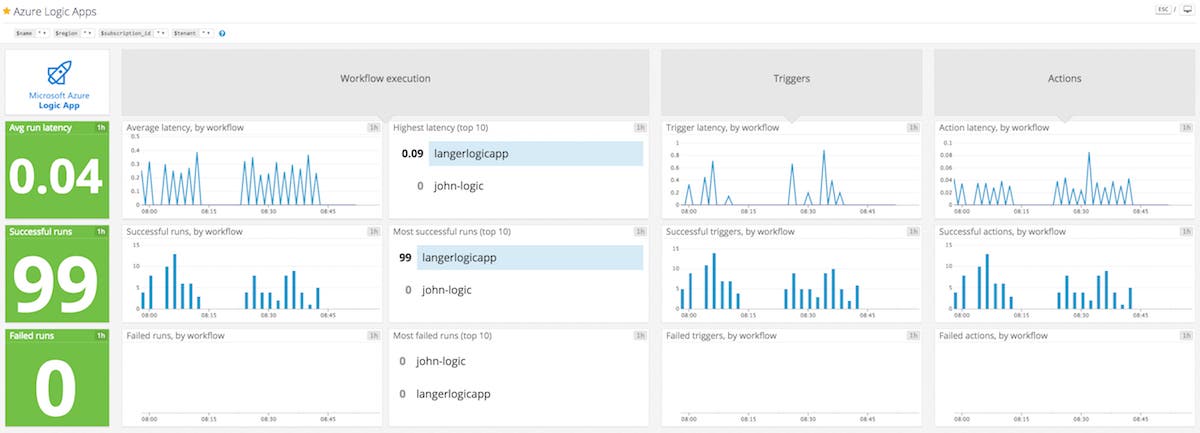
Our new integration lets you access more than 20 metrics from Azure Logic Apps. The metrics cover overall workflows (latency, runs completed, runs failed), plus metrics at a more granular level, including event triggers and the resulting actions.
As soon as you enable the Azure integration, you will see your metrics populating a customizable dashboard for Azure Logic Apps in Datadog. You can easily send alerts via email, Slack, HipChat, or on-call management tools like PagerDuty if workflow errors start to pile up, or if your actions take too long to execute.
Because Azure metrics are automatically tagged with relevant attributes in Datadog, you can slice and dice your metrics along any axis you want. For example, you can monitor the aggregate number of completed actions across all your workflows, or set up an alert for failed runs and apply it to only those workflows running in your production Azure account.
The expanding Azure sea
Logic Apps joins a rapidly growing list of Azure services supported in Datadog, including Azure VMs, Azure App Service, Azure SQL Databases, and, as of today, Azure Redis Cache, which we’ll cover in a forthcoming post. In total, Datadog integrates with more than 1,000 popular technologies, so you can monitor your entire application infrastructure in one place.
The metrics from Azure Logic Apps are available thanks to our integration with Azure’s new Metrics API, which was announced today at Microsoft Ignite. We will continue to add new Azure integrations to Datadog as additional Azure services are connected to the new Metrics API.
See the logic!
If you’re already using Datadog to monitor your infrastructure and applications, you can set up our integration to start graphing, alerting, and correlating Azure Logic Apps metrics today. If you’d like to see how Datadog can help bring observability to your Azure cloud apps and infrastructure, you can sign up for a free trial here.
