Adam Michael Wood
Amazon Simple Storage Service (S3) is a highly scalable object store. Files, or “objects,” can be uploaded and retrieved through a simple web interface, the AWS command line tool, a RESTful API, or one of several language-specific SDKs. Objects in S3 are organized into directories and subdirectories within “buckets.”
Buckets can store an unlimited number of objects, each of which can be up to 5 terabytes in size, making S3 an extremely versatile storage service. AWS S3 is ideal for storing web assets, static site hosting, backup and recovery, archiving, and general-purpose file storage. And because it is a fully hosted service, request handling, provisioning, maintenance, and all other server management tasks are handled automatically.
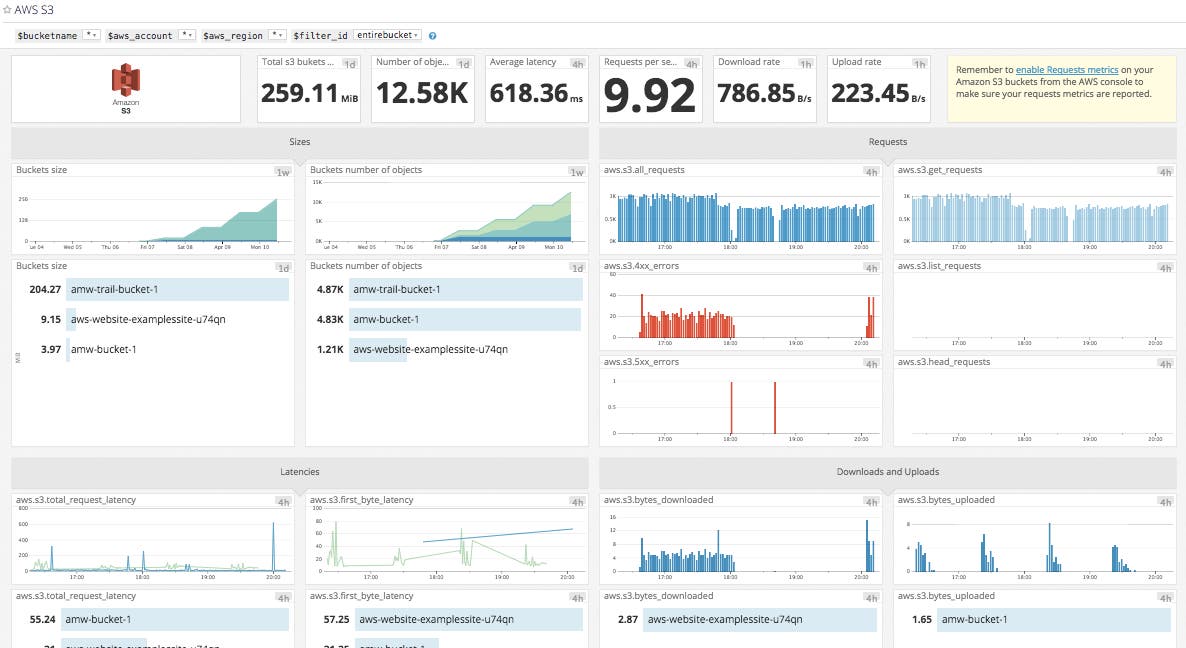
Datadog’s AWS S3 integration collects and visualizes the full range of S3 metrics for in-depth service monitoring and actionable insight into performance and usage. As soon as you enable the integration, Datadog will begin to collect metrics from S3 and visualize them in an out-of-the-box S3 dashboard.

Available S3 metrics
Datadog provides access to a large number of S3 activity metrics, most of which fall into the work metrics category:
- Throughput metrics include the number of requests made to S3, both in aggregate and broken down by request type (GET, PUT, etc.)
- Error metrics are available for 4xx and 5xx HTTP errors. 4xx errors from S3 are often attributable to 404 errors from broken links, so these are not always “errors” in the sense of a problem inherent to S3. However, a high number of 4xx errors likely points to a problem somewhere else.
- Performance metrics include the time to first byte, as well as the average, minimum, and maximum end-to-end latency per request.
The most relevant resource metrics provide data on total bytes stored, bytes transferred, and total number of stored objects, which let you gauge overall use.
Setup and integration
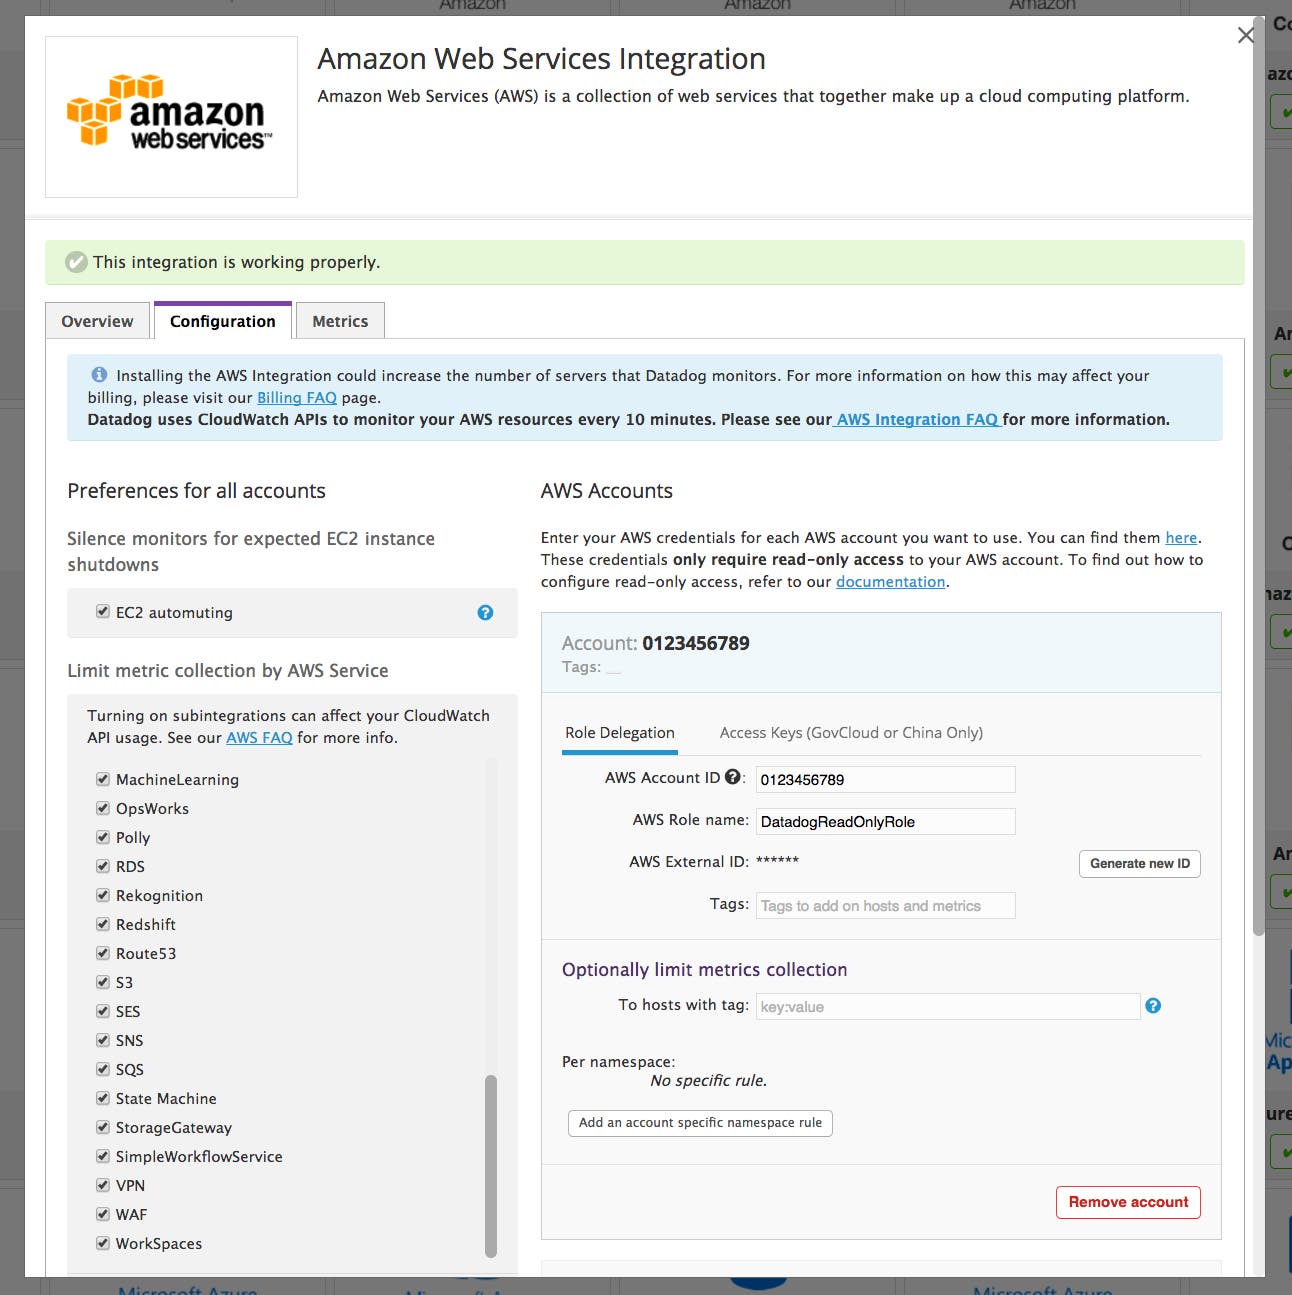
To monitor your AWS S3 metrics in Datadog, first install the main AWS integration by providing user credentials for a read-only Role defined in IAM as detailed in our documentation. Once the main AWS integration is configured, enable S3 metric collection by checking the S3 box in the service sidebar. Note that most S3 metrics are available only if you enable request metrics for the buckets you want to monitor.

Correlate for full visibility into web resources
More often than not, you’ll be using S3 to store web-accessible assets. In this case, S3 doesn’t usually serve files directly. Rather, a content delivery network like AWS CloudFront handles the HTTP request.
CloudFront sits between your S3 storage and the consumers of your files. It is analogous to the web server in a conventional server setup, with S3 acting as the database or file system underneath. CloudFront caches objects when serving them, so not every web request makes it all the way to S3. Because of this, some of the relevant metrics related to S3 object consumption, such as requests and 4xx errors, are actually captured in CloudFront metrics.
Because Datadog integrates with more than 1,000 technologies, including CloudFront and other AWS services, you can easily track S3 metrics alongside data from CloudFront to ensure that you have complete visibility into the resources for your website and how they are being accessed.

Get started
If you are already a Datadog user, you can start monitoring S3 as part of our integration with AWS. Otherwise you can sign up for a free trial and immediately start monitoring S3 and other AWS services, alongside the rest of your applications and infrastructure.


