Geoffrey Carlisle

Lauren Smith

Jonathan Epstein
Government agencies, educational institutions, and other public-sector organizations face a unique challenge when it comes to the cloud: how can they successfully migrate their operations while maintaining an air-tight, heavily regulated, massively distributed environment? To solve this problem, Amazon created the AWS GovCloud (US), two isolated Regions in the AWS ecosystem that are only accessible to US customers who meet strict security and compliance standards. Datadog has achieved Moderate-Impact authorization from the Federal Risk and Authorization Management Program (FedRAMP), meaning that you can use Datadog to safely and securely monitor infrastructure and workloads running in your AWS GovCloud (US) environment.
Complete visibility into your AWS GovCloud (US) environment
Datadog lets you monitor your AWS GovCloud (US) infrastructure and visualize key data, from host health and latency distribution to memory allocation, error rates, endpoint performance, and more. Once you install the AWS integration and add your AWS account using an access key, Datadog automatically begins collecting your AWS environmental data. You can then visualize it using out-of-the-box dashboards and use any of our alert types to automatically catch issues. And, because Datadog integrates with more than 1,000 unique technologies, you can surface problems and find their correlating factors across the entirety of your stack, giving you greater visibility into any issues you might detect.
Full-stack AWS monitoring
Datadog integrates with the full suite of AWS services, including Amazon EC2, AWS Lambda, and Amazon S3. This makes it easy to gather the most business-critical metrics from your AWS GovCloud (US) environment into Datadog. For instance, once you’ve installed the AWS integration, you can begin exploring the status and health of your EC2 instances in an out-of-the-box dashboard in order to spot CPU usage inconsistencies across different host types.
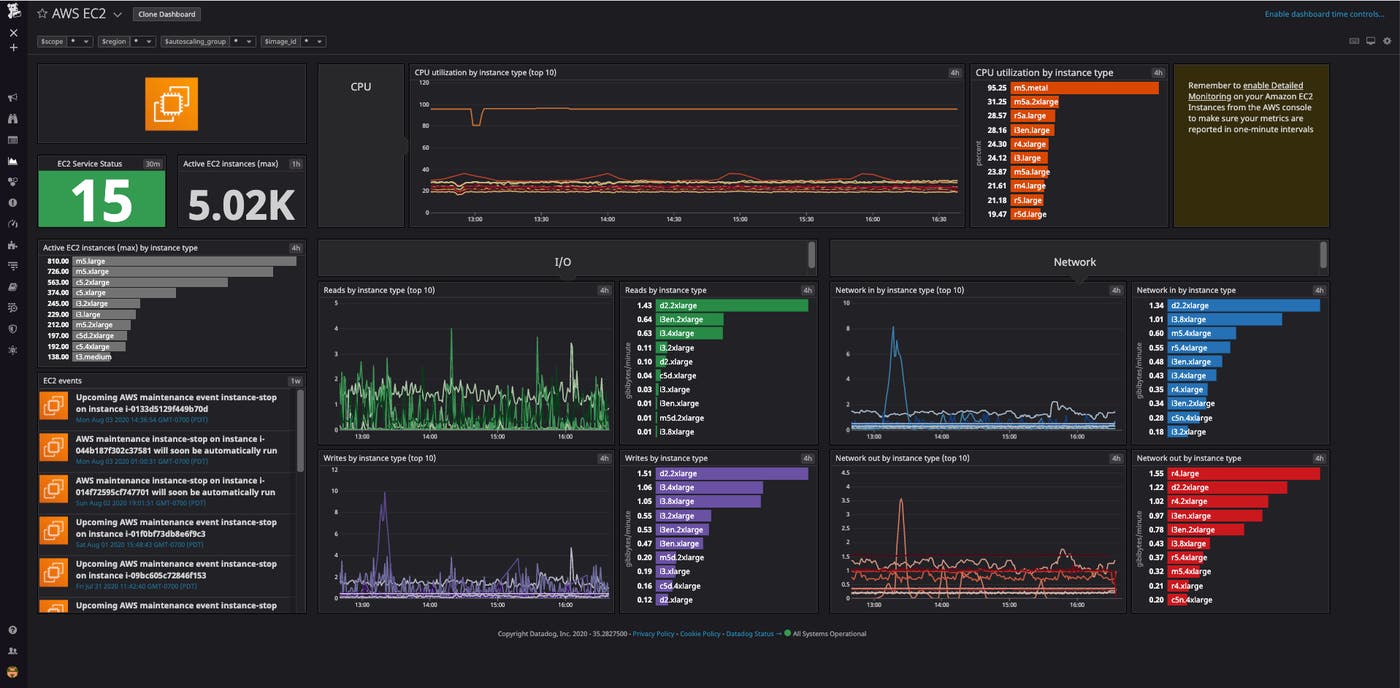
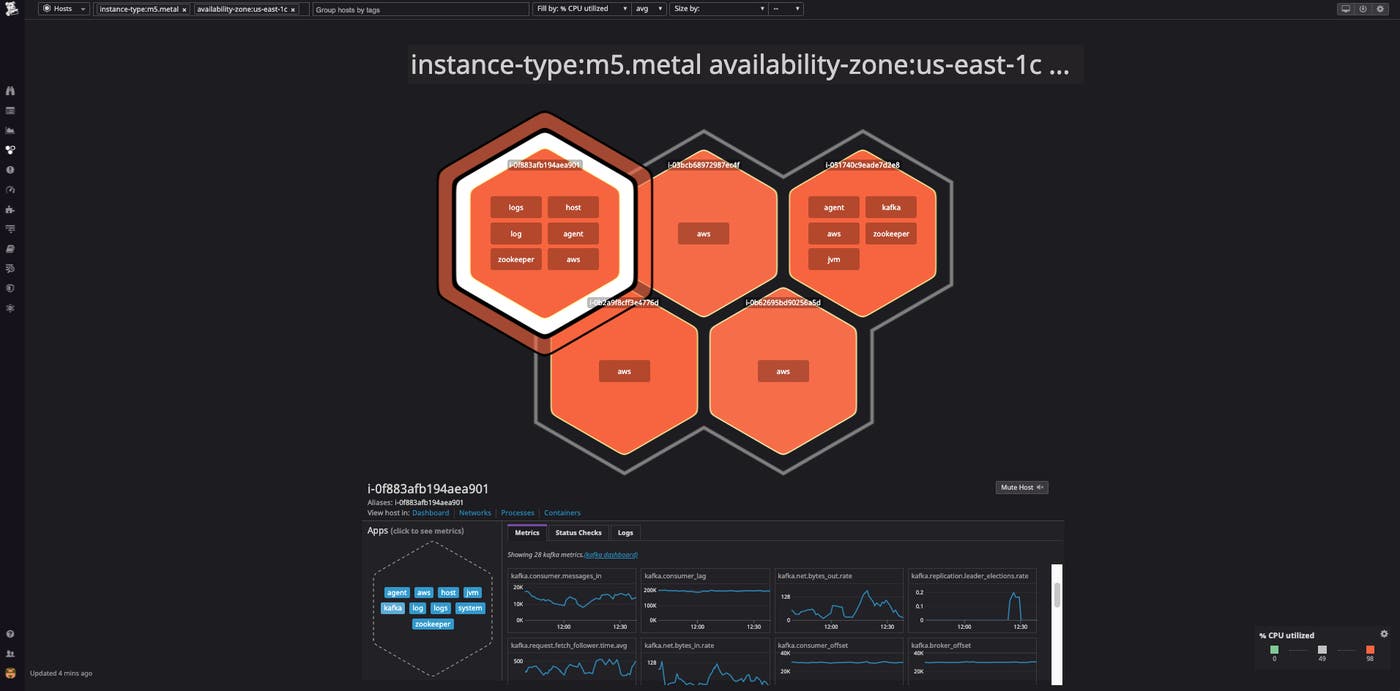
After you’ve discovered a possible pain point, you can drill down and contextualize the problem against your entire stack. In the above screenshot, we can see that ‘m5.metal’ host types are running close to full CPU utilization. We can then move to an ‘m5.metal’ host dashboard that displays all of the relevant hosts in one place. Sort them by tags (e.g., security groups, Availability Zones, etc.) to see if the problem is restricted to a single resource grouping. You can also inspect additional observability data of each resource to find the source of the problem. For example, by ingesting your AWS service logs into Datadog using the AWS Data Firehose, you can use the Log Explorer to search and analyze your logs and troubleshoot issues in real-time.
Once you install the Datadog Agent across your AWS environment, you can also view the logs and metrics from any services that you might be running in your stack, such as Apache Kafka and Zookeeper. This means you can correlate data from each layer of your environment from a single pane of glass. By zooming in on a host with high CPU utilization, you might discover a sudden spike in Kafka in/out requests (‘kafka.net.bytes_in.rate’, ‘kafka.net.bytes_out.rate’), which contextualizes the host’s processing availability and lets you pinpoint the moment when the problem began.
Simplify your inventory management
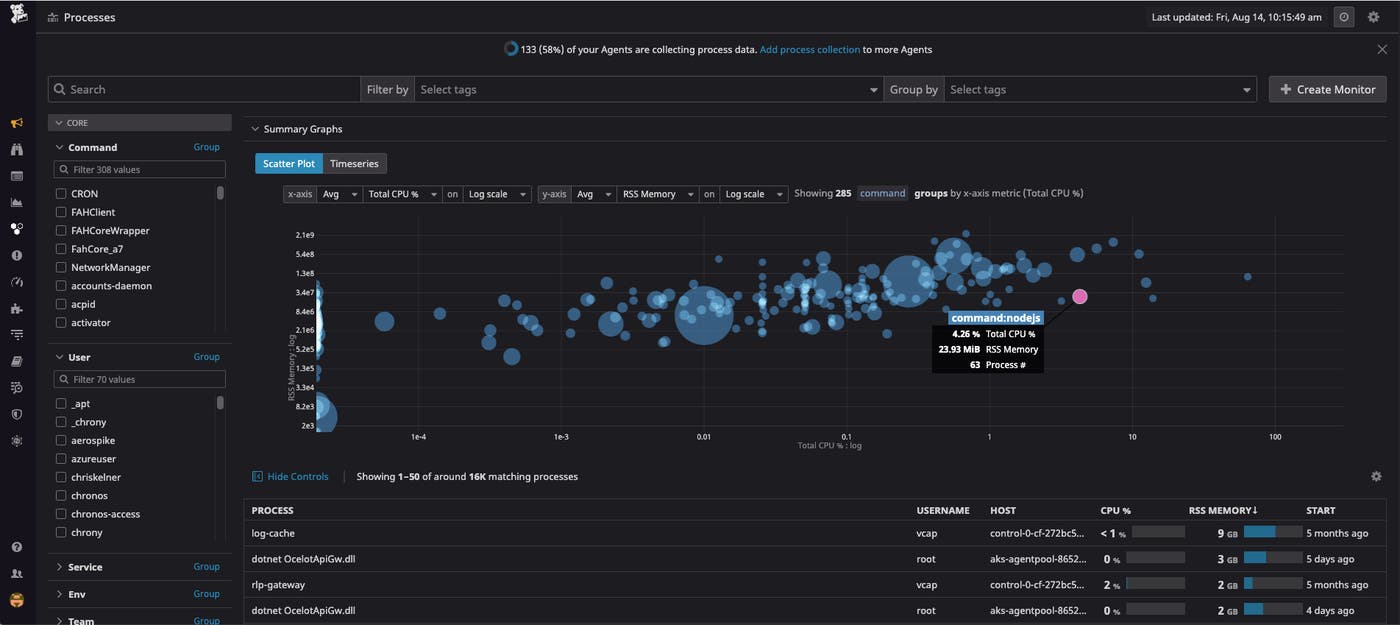
Datadog can also help you manage your cloud asset inventory. By monitoring key infrastructure metrics on your hosts, containers, processes, networks, and more, Datadog gives you real-time insight into the overall posturing of your environment. And by using Datadog’s metric correlation detection tools, you can quickly discern critical interactions between your assets and find the source of pain points as they occur.
Many compliance frameworks require that your hosts run the most current firmware or OS version available. By tagging the host instances within your GovCloud environment, you can quickly slice your infrastructure map according to criteria like OS and hardware version, Region, AMI ID, or Kubernetes cluster. This way, you can easily spot outliers, update the obsolete hosts, and make sure that new systems have been successfully rolled out.
Monitor your GovCloud environment and entire IT infrastructure
Datadog provides unified visibility into your entire AWS environment, which includes any services running in AWS GovCloud (US). In addition to offering comprehensive cloud monitoring capabilities, we’ve recently expanded our support for the public sector by introducing Network Device Monitoring (NDM), Database Monitoring (DBM), and Cloud Security to our FedRAMP Moderate Impact authorized region. Introducing these solutions is another important step in allowing government agencies to monitor and secure their entire IT infrastructure in one unified platform.
If you’re already a Datadog customer, you can begin setting up your AWS GovCloud (US) integrations now. Otherwise, get started with a 14-day free trial. And for more tips on monitoring the full suite of AWS services, check out the other AWS articles on our blog.
