Ryan Warrier

Emily Chang
AWS Service Quotas helps you manage limits on the number of resources or API operations that are possible for a given AWS service. Hitting such limits could cause operational disruptions related to getting rate limited on the critical APIs that your applications rely on or being unable to provision additional AWS resources.
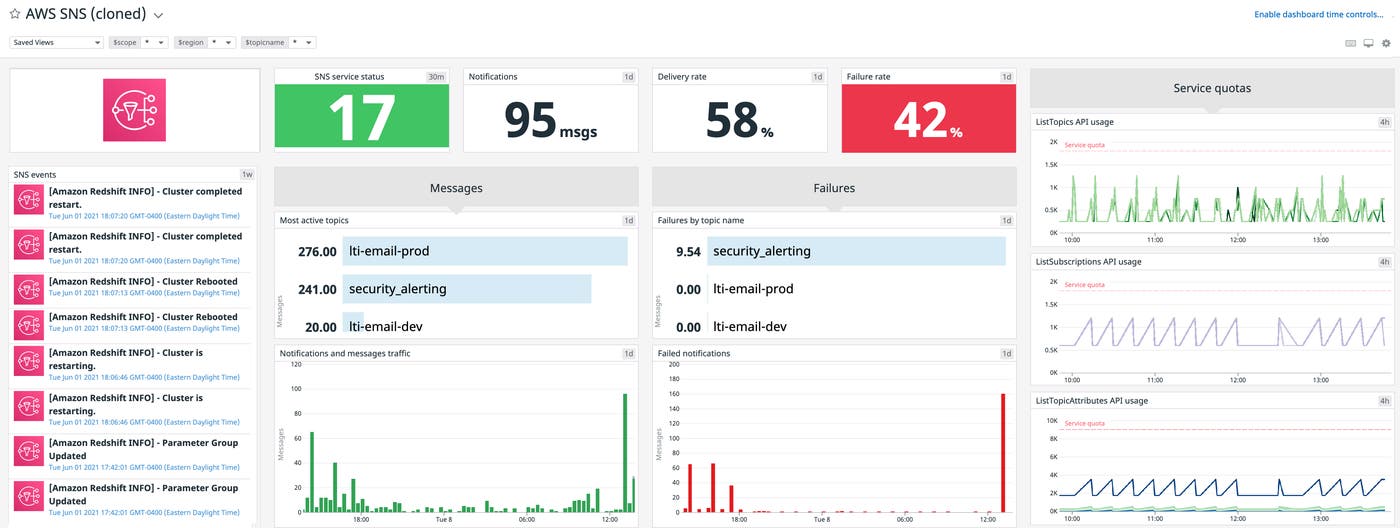
Service quotas are defined for around 200 AWS services, but until recently, only a subset of these were available to monitor via CloudWatch metrics. However, AWS recently announced CloudWatch support for control plane API usage metrics across AWS services. These metrics are automatically available in Datadog through our AWS integration, so you can track service quota utilization and take action before issues arise (e.g., by contacting AWS for a quota increase). You can also clone and customize your AWS dashboards to monitor key control plane API usage metrics alongside performance metrics from your AWS services, as shown in the rightmost column of the Amazon SNS dashboard below.
How to monitor AWS control plane API usage metrics
AWS control plane APIs are responsible for resource-related CRUD operations that happen in your account, such as creating and terminating resources or requesting information about them (e.g., Amazon EC2’s RunInstances, DescribeInstances, StopInstances or Amazon S3’s CreateBucket, GetBucket, DeleteBucket). Using the newly available CloudWatch metrics to track these types of API calls is a significant improvement and will allow you to monitor API call rate quotas more proactively with Datadog dashboards and alerts.
Alert on AWS control plane API usage
You can automatically start tracking significant changes in control plane API calls in your AWS account by using Datadog’s existing aws.usage.call_count.sum metric (which tracks the total number of API calls over a specified period). Simply filter this metric by service or resource, based on the type of API usage you want to monitor.
For example, suppose you are using AWS Secrets Manager and want to be alerted if you are about to get rate limited for the GetSecretValue API operation, which has a default request quota of 5,000 calls per second that you don’t want to exceed.
Since CloudWatch aggregates and reports CallCount metrics over each one-minute interval, this roughly translates into a limit of 300,000 calls per minute. Keep in mind that if usage exceeds the per-second quota at any point within that minute, you will still get throttled even if the metric doesn’t exceed the calculated per-minute quota (e.g., if usage remained below the quota during most of that period).
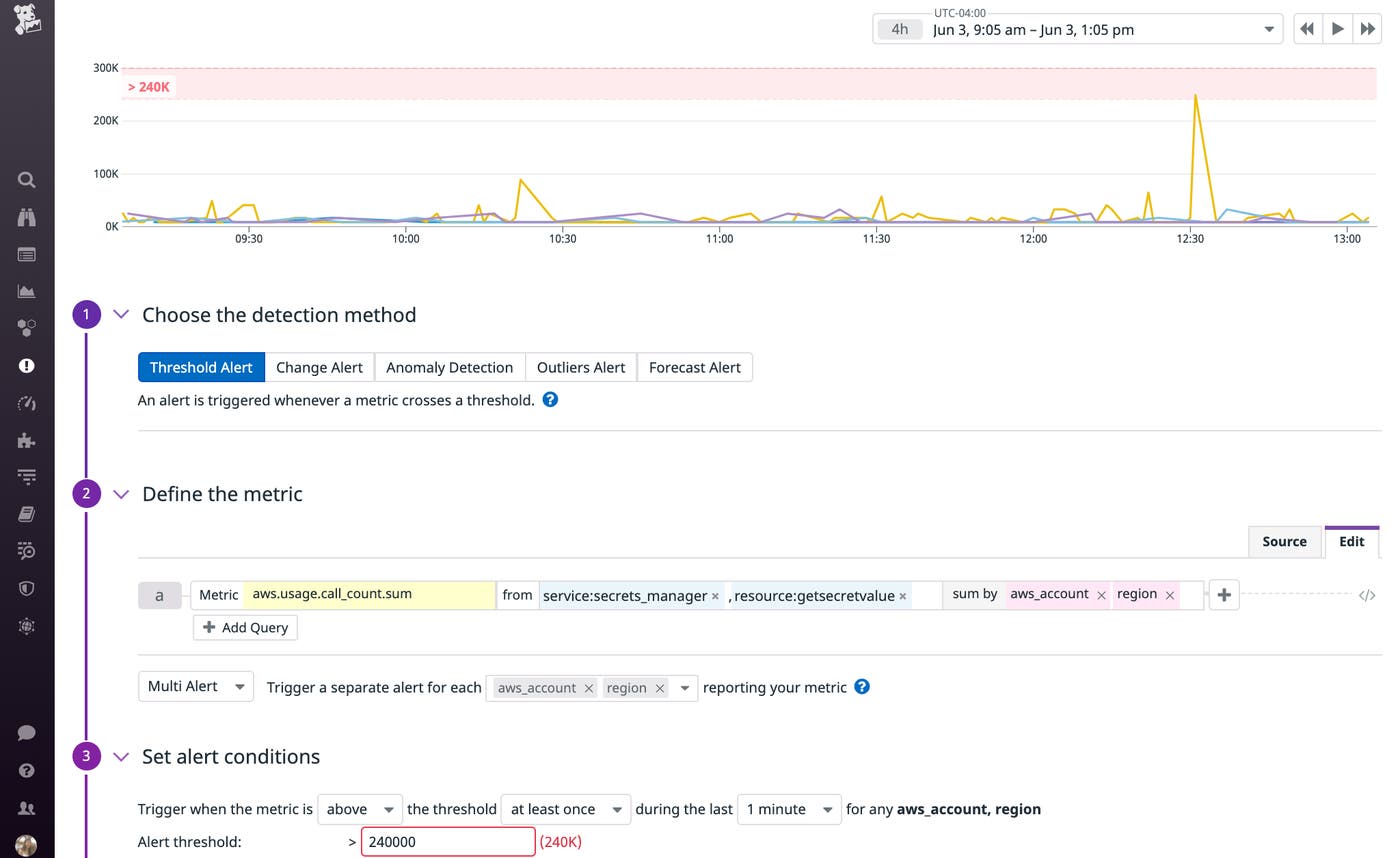
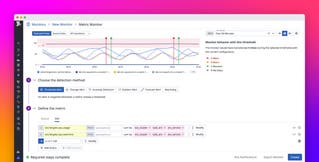
Above, we configured an alert to notify us if the metric hits 80 percent of this limit (240,000 API calls per minute), so that we have some advance notice. Since this rate limit is enforced per account and per region, we set up this alert to track the metric for each account/region pair.
Spot abnormal trends in AWS control plane API usage
In addition to using threshold-based alerts to detect when you’re in danger of getting rate limited, you can also use features like anomaly detection to uncover problematic trends in AWS control plane API usage. In the example below, the rate of AWS KMS ListKeys requests normally peaks on weekdays, but we can see an abnormal spike in usage on March 21st (a Sunday), followed by additional abnormal spikes over the next five days.

Although this metric is still reporting a value that falls under the service limit of 500 requests per second (or 30,000 per minute), we may still want to check if we mistakenly deployed a change that is causing our application to call this API more frequently than needed. If the increased usage looks legitimate, we can also consider requesting a quota increase.
Start monitoring AWS control plane API usage
If you’ve already integrated AWS with Datadog, you can immediately start using AWS control plane API usage metrics in your dashboards and alerts. Otherwise, you’ll just need to set up our AWS integration. Then navigate to the AWS integration tile in Datadog, check the “Usage” box in the sidebar, and click “Update Configuration” at the bottom to enable this globally for all your AWS accounts. You can also configure this more granularly by creating account-specific namespace rules to enable or disable these metrics for specific AWS accounts. Within minutes, you should start seeing call rate metrics flowing into Datadog.
If you’re not yet using Datadog, sign up for a free trial to get started.


