

Apache Ignite is a computing platform for storing and processing large datasets in memory. Ignite can leverage hardware RAM as both a caching and storage layer to serve as a distributed, in-memory database or data grid. This allows Ignite to ingest and process complex datasets—such as those from real-time machine learning and analytics systems—in parallel and at faster speeds than traditional databases supported by only disk storage.
Because industries rely on Ignite to accelerate processing for vital real-time data, getting visibility into the performance of Apache Ignite clusters and nodes is necessary to ensure they can support mission-critical applications. To help you monitor the health and performance of your Ignite architecture, we are excited to announce Datadog’s Apache Ignite integration, which collects node and cluster-wide memory, cache, and storage metrics and logs.
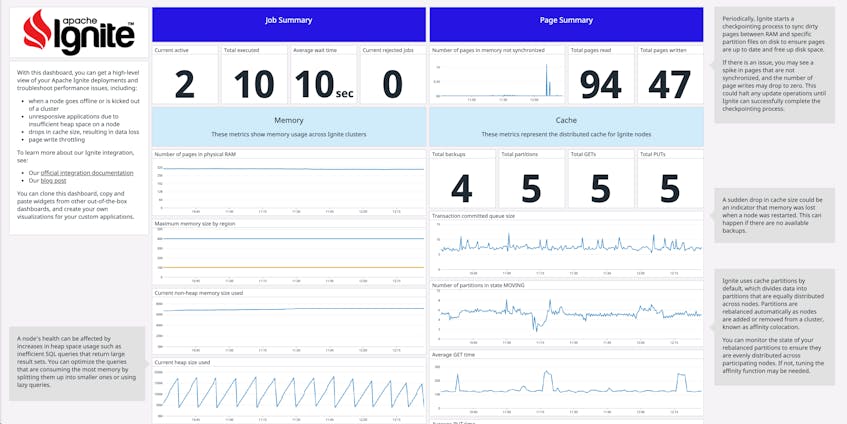
The integration is included with version 7+ of the Datadog Agent. Once you deploy and configure the Agent, you can start collecting and visualizing metrics from your Ignite nodes on an out-of-the-box dashboard. This means you can easily view key data on cache, memory, thread, page, and job activity, giving you an at-a-glance understanding of Ignite throughput and performance.
Monitor Ignite and JVM
As part of its architecture, Ignite uses Java virtual machines (JVM) to run server and client nodes. Server nodes are the base units for compute tasks or data storage and can be grouped together into clusters to pool resources for an application. Applications connect to a cluster via a client node. Datadog’s new integration helps you monitor the state of your Ignite clusters and individual nodes, as well as the performance of all running JVMs.
As with other Java-based platforms like Tomcat or Cassandra that expose JMX metrics, the Datadog Agent connects to Ignite’s JMX server to capture performance data from both Ignite and the underlying JVMs. This gives you a comprehensive view of Ignite’s performance and the flexibility to collect only the metrics that are most important to you.
Understand the state of your nodes
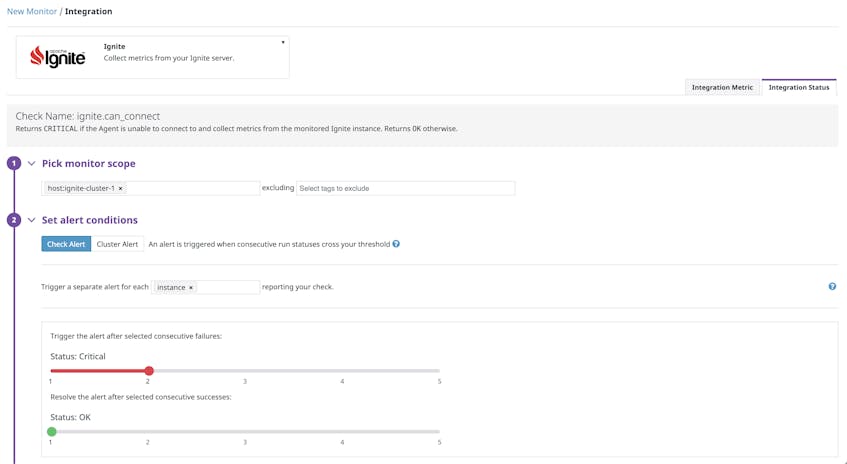
When a node goes offline, you will want to know about it as soon as possible to minimize the possibility of your application becoming unresponsive. The Agent includes a built-in health check for Ignite, which you can use to create an alert and notify you when a node goes offline.
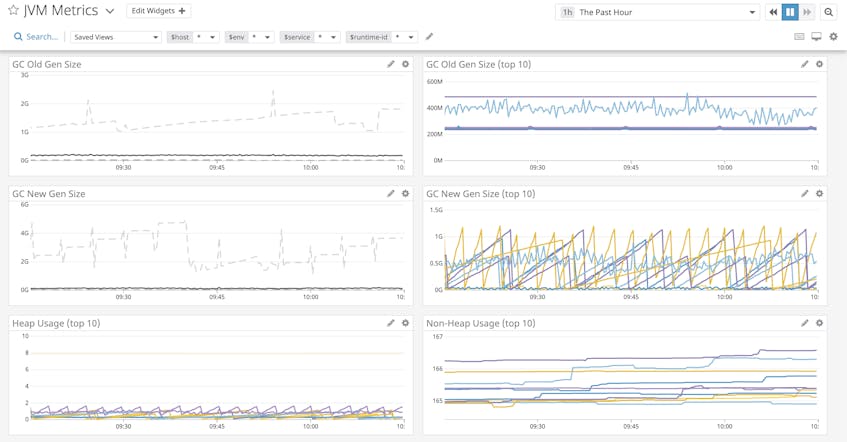
If a node goes offline or is kicked out of a cluster, you can use Datadog’s out-of-the-box JVM metrics dashboard to investigate. For example, a node’s health can be affected by increases in old generation size for the garbage collector, which is an indicator that an application is creating too many long-lived objects for the node to support. This causes the garbage collector to pause more frequently while it removes the old objects.
You can also review garbage collection (GC) logs in the Log Explorer to get more detailed information about GC activity. If you are seeing an increase in logs for GC pauses, for example, you may need to tune garbage collection.
Track memory usage across every node
Ignite nodes can also quickly run out of memory if they are not configured with enough heap space to support an application. When this happens, you may see OutOfMemoryError exceptions in the logs, and the application may become unresponsive.
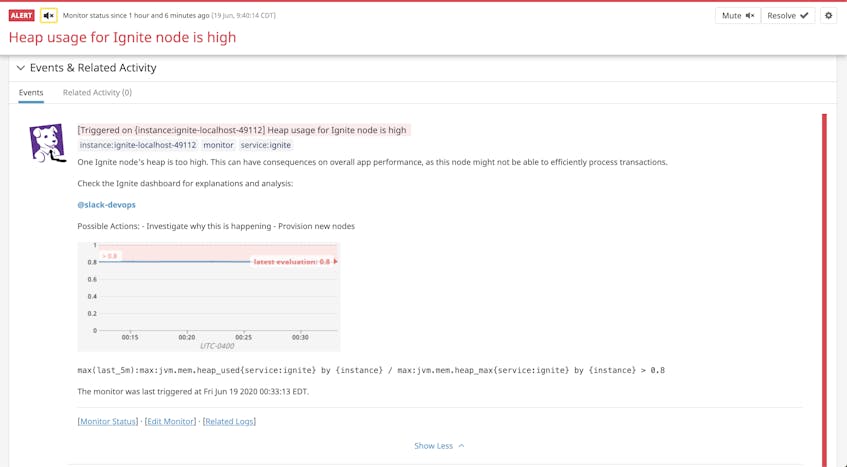
Datadog’s built-in Ignite dashboard enables you to monitor memory usage across your Ignite nodes so you can respond accordingly. You can also create alerts to automatically notify you when a node is seeing a significant increase in used heap memory.
Increases in heap space usage are often a result of inefficient SQL queries that return large result sets. With Datadog APM, you can trace your Java application to find exactly where the bottlenecks are so you can optimize the queries that are consuming the most memory by splitting them up into smaller ones or using lazy queries.
Datadog + Ignite
With Datadog’s new integration, you can collect Ignite metrics and logs to get deeper insights into the health of your in-memory cache, data grid, or database. And Datadog supports a wide variety of environments—from on-premise hardware to Kubernetes clusters in the cloud—so you can always track the performance of your Ignite infrastructure, regardless of where it is deployed. Sign up for a free trial to get started.
