Jordan Obey
Apache Ambari is an open source management tool that helps organizations operate Hadoop clusters at scale. Ambari provides a web UI and REST API to help users configure, spin up, and monitor Hadoop clusters with one centralized platform.
As your Hadoop deployment grows in size and complexity, you need deep visibility into your clusters as well as the Ambari servers that manage them. If issues arise in Ambari, it can lead to problems in your data pipelines and cripple your ability to manage clusters. With Datadog’s new integration, you can monitor the performance of your Ambari servers along with Hadoop and other technologies in your stack, such as Apache Spark and PostgreSQL.

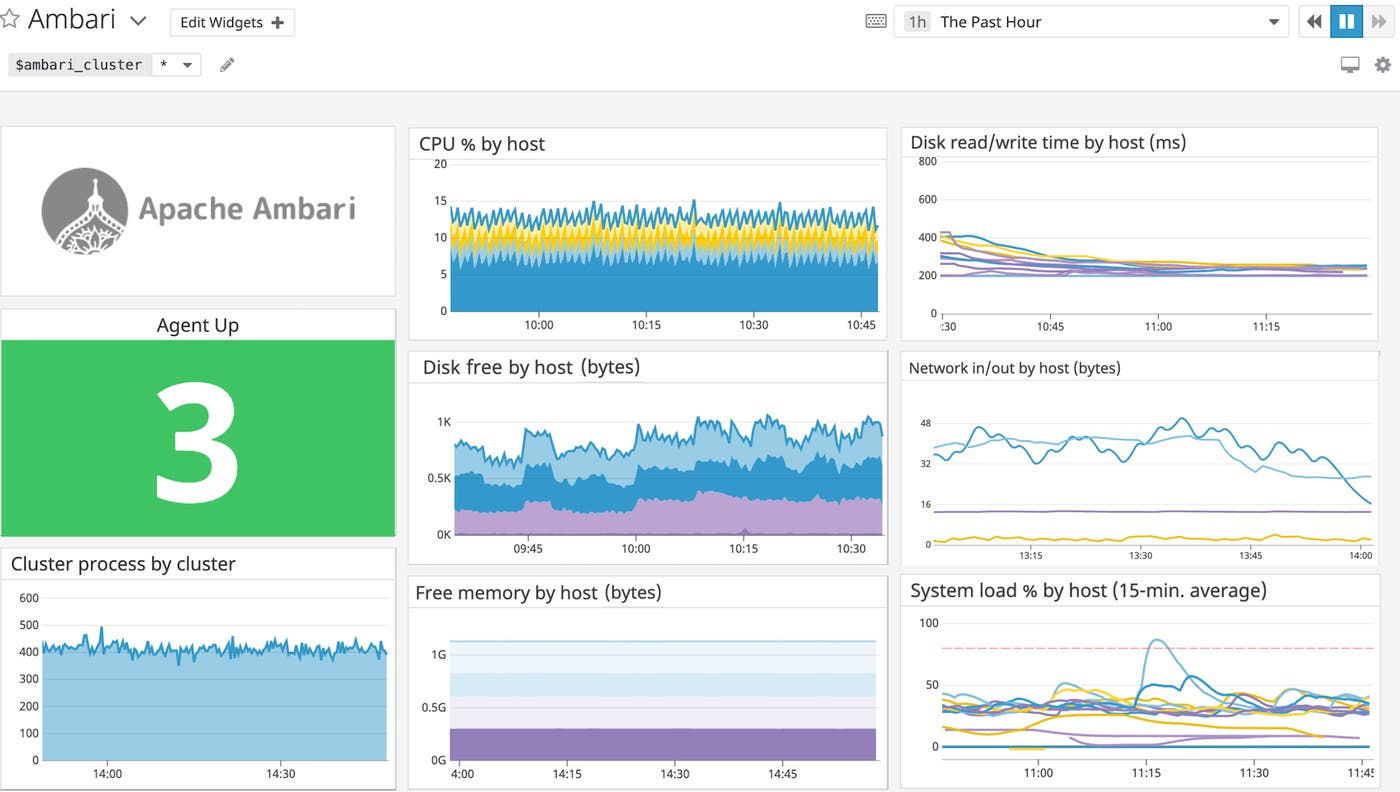
Datadog’s Ambari integration includes an out-of-the-box dashboard that displays key resource utilization metrics from your Ambari servers, such as memory, disk space, load averages, and more. Datadog automatically tags Ambari metrics by Ambari cluster, service, and component so you can easily drill down to the parts of your infrastructure you’re most interested in.
You can also customize dashboards to include metrics from related components of your infrastructure. For example, you can visualize data from Hadoop next to incoming metrics from the backend database your Ambari servers are using (PostgreSQL, by default) to help discover and troubleshoot issues as they occur.
Track Ambari resource availability to troubleshoot performance issues
If your Ambari servers are exhibiting performance issues (e.g., the web UI has become slow and unresponsive), you can correlate load averages with other resource metrics from your Ambari servers to see if a resource deficit is the cause of the slowdown. If load averages are higher than usual while available resources are low, your systems could be overloaded.

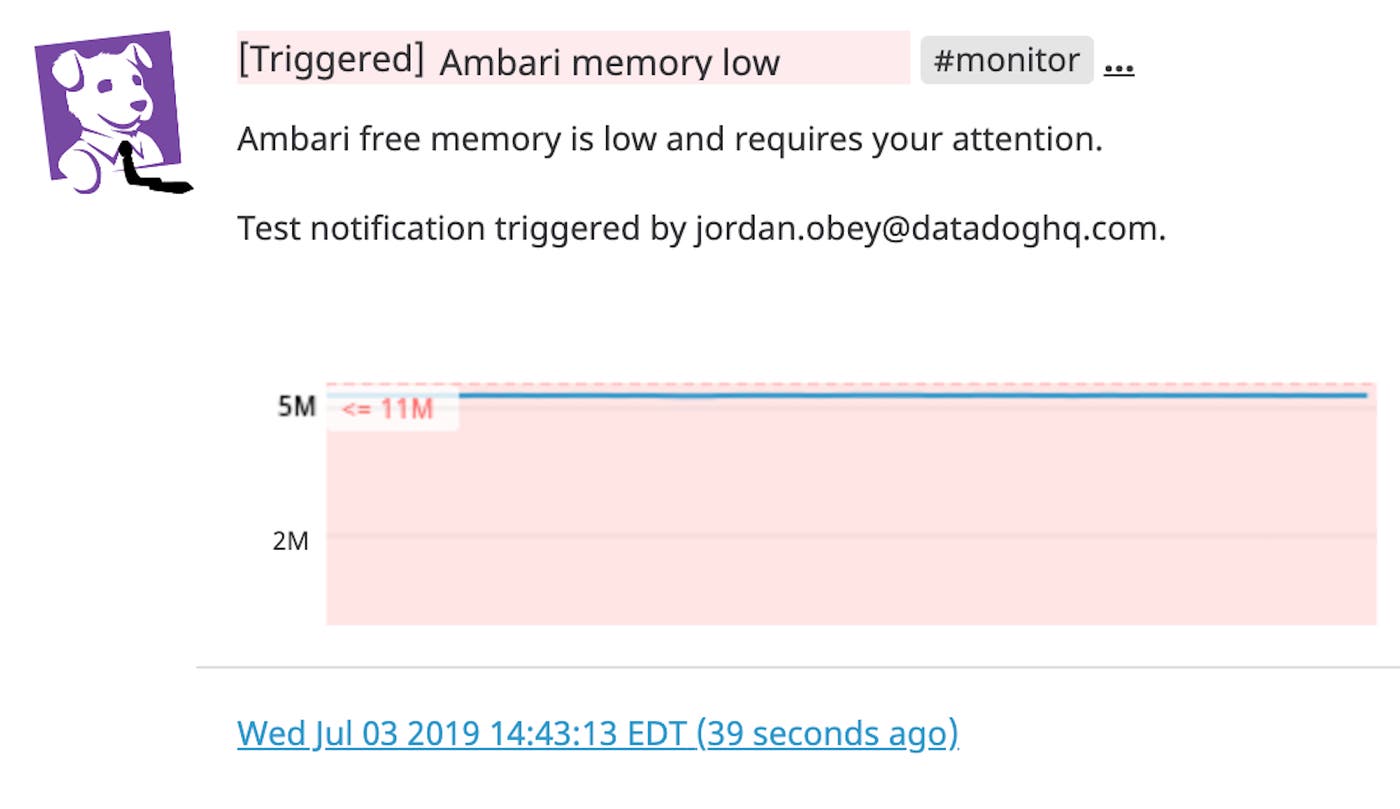
You can set up threshold or machine-learning-driven alerts on your Ambari servers’ resource availability so you can take preemptive action before users are affected. For example, create an alert to automatically notify you if available memory drops below a specified level. This can give you time to follow the steps mentioned in Ambari’s documentation to adjust server heap size to accommodate the size of your cluster and increase memory before your system slows.

If memory is available but the web UI is still unresponsive, it may indicate that Ambari’s database is nearing capacity. Ambari uses a database to store cluster data like service configuration and state. Datadog integrates with all of the database backends Ambari supports, including PostgreSQL, MySQL, and Oracle. This makes it easy to monitor your Ambari database backend alongside the overall health of your Ambari servers. If the database is near capacity, you can clear it of historical data by stopping the server and running a db-purge-history CLI command to help improve Ambari performance.
Dig deeper with logs
To get even more granular insights into your Ambari deployment, you can configure Datadog to collect Ambari logs, including:
- audit logs, which record permissions-related data, including users, the actions they perform, and their cluster roles
- server logs, which record configuration data, active processes, and errors from your servers
- alert logs, which record Ambari alerts on disk space, server performance, and connection issues
You can view Ambari logs in Datadog’s Log Explorer or use a log stream widget to view them directly in your Ambari dashboard.

Once you’re using Datadog to aggregate and monitor metrics and logs from your Ambari servers and related services, you can navigate across all of these sources of data to get a clearer picture of performance. For instance, you can monitor the health and performance of Ambari’s backend database in one dashboard, and then pivot to the relevant logs to pinpoint the likely root of an issue.
Configure Datadog to collect Ambari-managed Hadoop metrics
Ambari Metrics System automatically collects metrics from the Hadoop components it manages. Now, you can monitor all that data in Datadog—without installing the Datadog Agent directly on all of the servers Ambari manages.
To configure the Agent to automatically bring in metrics and/or service checks from Ambari-managed Hadoop components, specify the names of the services and components in the services section of your Ambari integration configuration file in the following format:
services: <SERVICE_NAME_1>: <COMPONENT_NAME_1>: - METRIC_HEADER_1 - METRIC_HEADER_2 <SERVICE_2>: <COMPONENT_NAME_2>: [][ … ]Note that if you do not specify any metrics for a component (e.g., <COMPONENT_NAME_2> above), the integration will only collect a status check from Ambari.
To collect metrics from YARN’s NodeManager and MapReduce’s Job History Server, for example, name YARN and MAPREDUCE as services and NODEMANAGER and JOBHISTORYSERVER as components, as shown below. Then under each component, list the metrics and/or status checks you want to collect.
services: YARN: NODEMANAGER: - cpu - disk - load - memory - network - process YARNCLIENT: [] MAPREDUCE: JOBHISTORYSERVER: - BufferPool - Memory - jvmAmbari’s remote cluster management page displays the names of all of the services and/or components it manages. You can also query Ambari’s REST API for this information. To see a list of HDFS components that Ambari is managing, for example, you could send the following request where <AMBARI_SERVER> and <CLUSTER_NAME> represent the names of your Ambari server and cluster respectively:
http://<AMBARI_SERVER>:8080/api/v1/clusters/<CLUSTER_NAME>/services/HDFS/componentsOnce you’ve configured the Datadog Agent to collect data from Ambari Metrics System, you’ll be able to monitor all of these components alongside the rest of your infrastructure.
Monitoring Ambari and the rest of your stack in one place
With Datadog’s Apache Ambari integration, you’ll have real-time visibility into Ambari’s resource usage and availability, allowing you to troubleshoot performance issues. Datadog integrates with more than 1,000 technologies—including Hadoop, Spark, Yarn, PostgreSQL, and other services that you’re running alongside Ambari—so you can get unified insights across every component of your dynamic big data architecture.
If you aren’t already using Datadog, get started with a 14-day free trial.


