

We just released an update to our integration making it easier than ever to monitor Amazon SQS. If you use SQS, you now have better visibility into the health of your message queues, their traffic patterns, and the state of the messages enabling you to identify and fix performance issues.
What is SQS?
Amazon’s Simple Queue Service (SQS) is a scalable, managed message queue in the AWS suite of services. It is well suited for applications that stream analytics. Like any message queue, SQS is best used to decouple services in your application and avoid a domino effect where one overloaded service takes the rest of the application down.
For instance, we use message queues at Datadog to separate metrics and event intake from processing to smooth out spikes in incoming traffic. The key to proper SQS operations is to ensure that queues are both not continuously increasing in length or going unused and starving for messages.
Key SQS metrics to monitor
All Amazon SQS metrics are prefixed with aws.sqs. in Datadog.
The SQS metrics are also tagged by queue name so that you can easily monitor your queues independently of one another (or monitor them as an aggregate).
number_of_messages_sent, number_of_messages_received
A measure of the flow of traffic into and out of your queue in the last five-minute period. If the number of empty receives stays consistently above 0, you may have too many eager consumers. You may want to space out their calls to SQS or run fewer consumers.
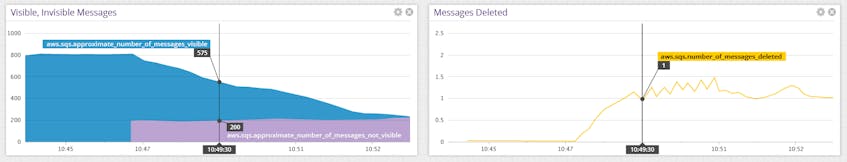
number_of_messages_deleted
The number of messages per period that have been successfully processed and removed from the queue. This is the real measure of your consumers’ throughput.
sent_message_size
The average size of messages that are being posted to a queue. SQS message size affects how much you pay for the service.
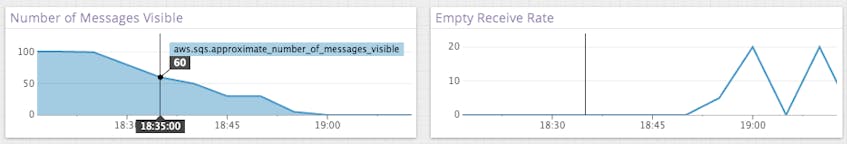
approximate_number_of_messages_visible
The size of your active queue; a measure of the queue’s backlog. If this metric grows over time you may need to add more consumers to make a dent in the backlog (or speed up the existing consumers).
approximate_number_of_messages_delayed
The number of messages that are in the delay period and not yet ready to be picked up by consumers.
approximate_number_of_messages_not_visible
The number of messages that are currently being worked on by a consumer. Once the consumer deletes the message it will be removed from this tally.
More information on SQS metrics can be found here.
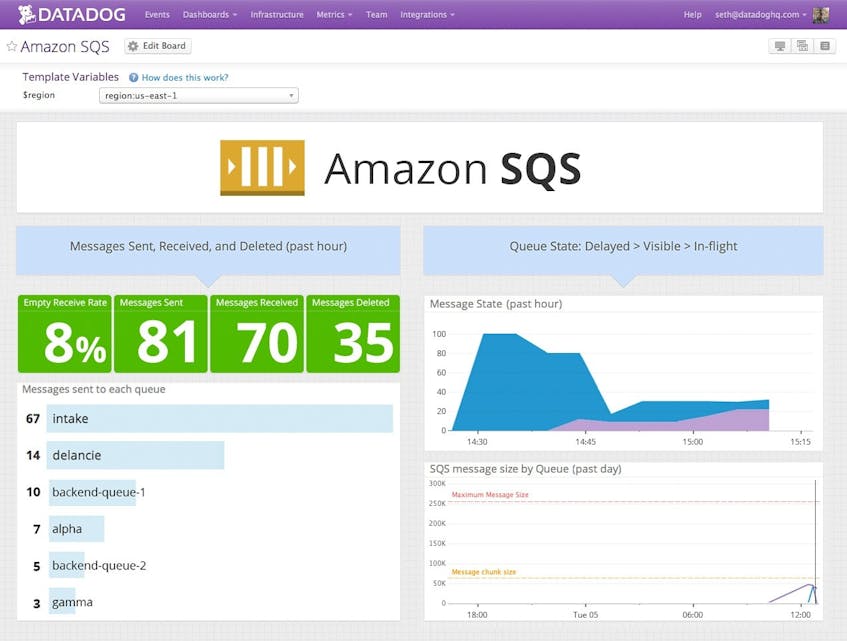
Immediate insights into your message queues
We’ve created an out-of-the-box Datadog screenboard to help you stay on top of your SQS usage. All of these metrics and the dashboard are available in Datadog when you enable our SQS integration.
Datadog timeboards let you mix and match metrics from AWS SQS and your applications so you can visualize the performance of your queues and message consumption applications all in one place. Below, you can see a side by side comparison of the SQS traffic flow and throughput of an application consuming its messages.
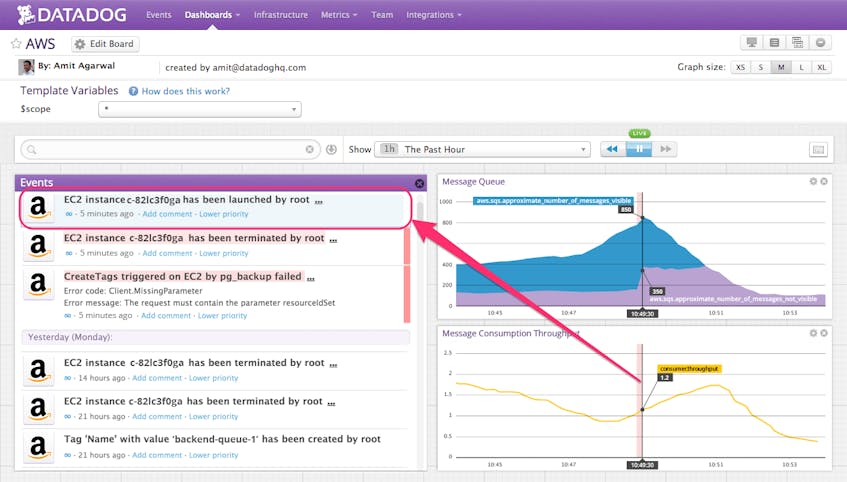
By overlaying AWS CloudTrail events (or other events from Datadog’s more than 750 integrations) you can confirm that spinning up a consumer instance when the queue size grows improves the message throughput in your application.
To monitor performance of your AWS SQS message patterns in conjunction with your applications and other AWS services, sign up for a free 14-day Datadog trial and enable your AWS SQS and other available AWS integrations in Datadog.
