Mary Jac Heuman
Amazon Route 53 provides DNS and traffic routing services for cloud applications. You can use Route 53 to define multiple routing policies to send requests to a variety of endpoints, and configure DNS health checks to re-route traffic for failover, ensuring high availability of your services.
Monitoring DNS health is crucial to ensuring your services can communicate with each other and that client-facing domains are publicly accessible. Datadog fully integrates with Route 53, pulling in CloudWatch metrics and providing full support for your DNS logs. In this post, we’ll look at how you can use Datadog to collect metrics and logs to get key insights into your network activity. We’ll also look at how you can use Datadog to monitor your Route 53 data for possible security threats.
Track Route 53 health and performance metrics
Once you’ve enabled Datadog’s AWS integration, Datadog ingests all CloudWatch metrics from your AWS services. For Route 53, these include data on DNS queries, health checks, and resolver endpoints.
AWS performs health checks every minute by default. Metrics like aws.route53.health_check_percentage_healthy allow you to easily track how many of your endpoints are responding as healthy. For finer detail, you can monitor data such as aws.route53.health_connection_time to see the average time it took the health checker to establish a TCP connection with an endpoint, so you can see exactly where any slowdowns are occurring.
If you’re using an Amazon VPC, the Route 53 Resolver forwards DNS queries to your network and sends metrics about the volume of queries it handled. By tracking resolver metrics like aws.route53resolver.inbound_query_volume and aws.route53resolver.outbound_query_volume, you can track query throughput between your Amazon VPCs and network to ensure communications aren’t being dropped by any endpoints.
You can alert on, visualize, and add any of these metrics to custom dashboards within Datadog. And, with our more than 1,000 other integrations, you can view Route 53 metrics alongside monitoring data from the rest of your stack.
Analyze DNS activity with Route 53 logs
Monitoring DNS logs is crucial to detecting backend outages and potential security attacks. Route 53 supports two logging configurations:
- Public DNS query logging, to log information about public requests to Route 53
- Resolver query logging, to log DNS queries within your Amazon VPCs and the responses to them
Route 53 logs contain valuable information about traffic into and within your environment, including the origin of the request, the edge location that handled it, whether or not the domain name resolved, and, if so, what IP the domain resolved to. But, it can be difficult to sift through a high volume of logs to get the data you care about. With full support for Route 53 DNS logs, you can use Datadog to ingest, analyze, and alert on every request to your applications, giving you full visibility into the health, performance, and security of your backend services.
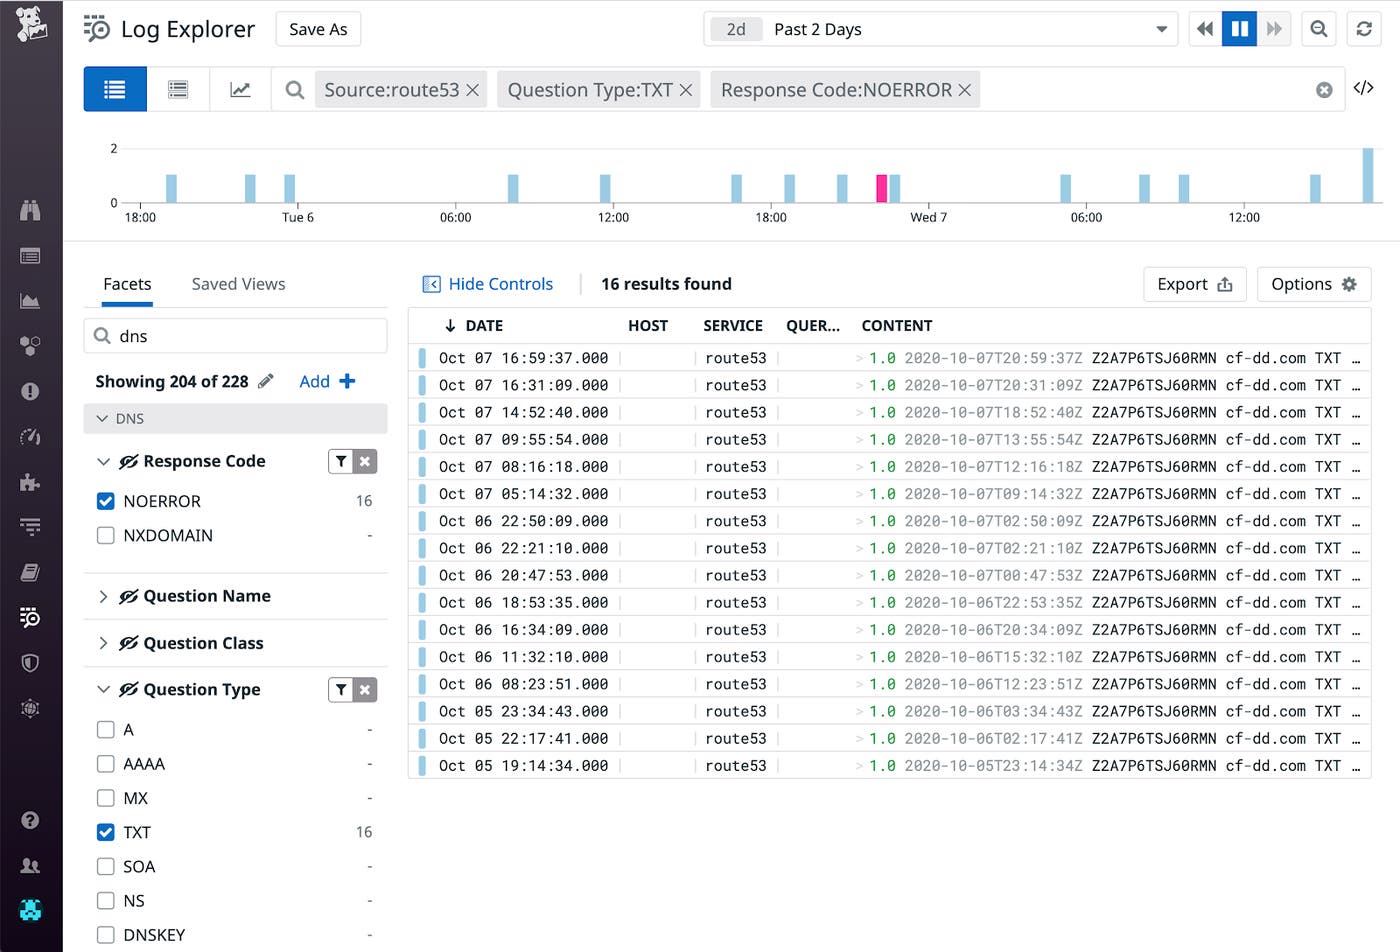
Once you’ve set up Route 53 log collection, Datadog will begin collecting all of your query logs. Datadog parses your Route 53 logs on ingestion using an out-of-the-box processing pipeline and enriches them with key attributes that includes the domain or subdomain requested, the date and time of the request, the DNS record type, the edge location that responded to the query, and the response code received (e.g., NoError or ServerFail). You can then easily search, filter, and sort your logs on any of these attributes in the Log Explorer. You can also customize the log pipeline to parse out and add additional fields and apply tags depending on your needs.
Visualize key Route 53 log data
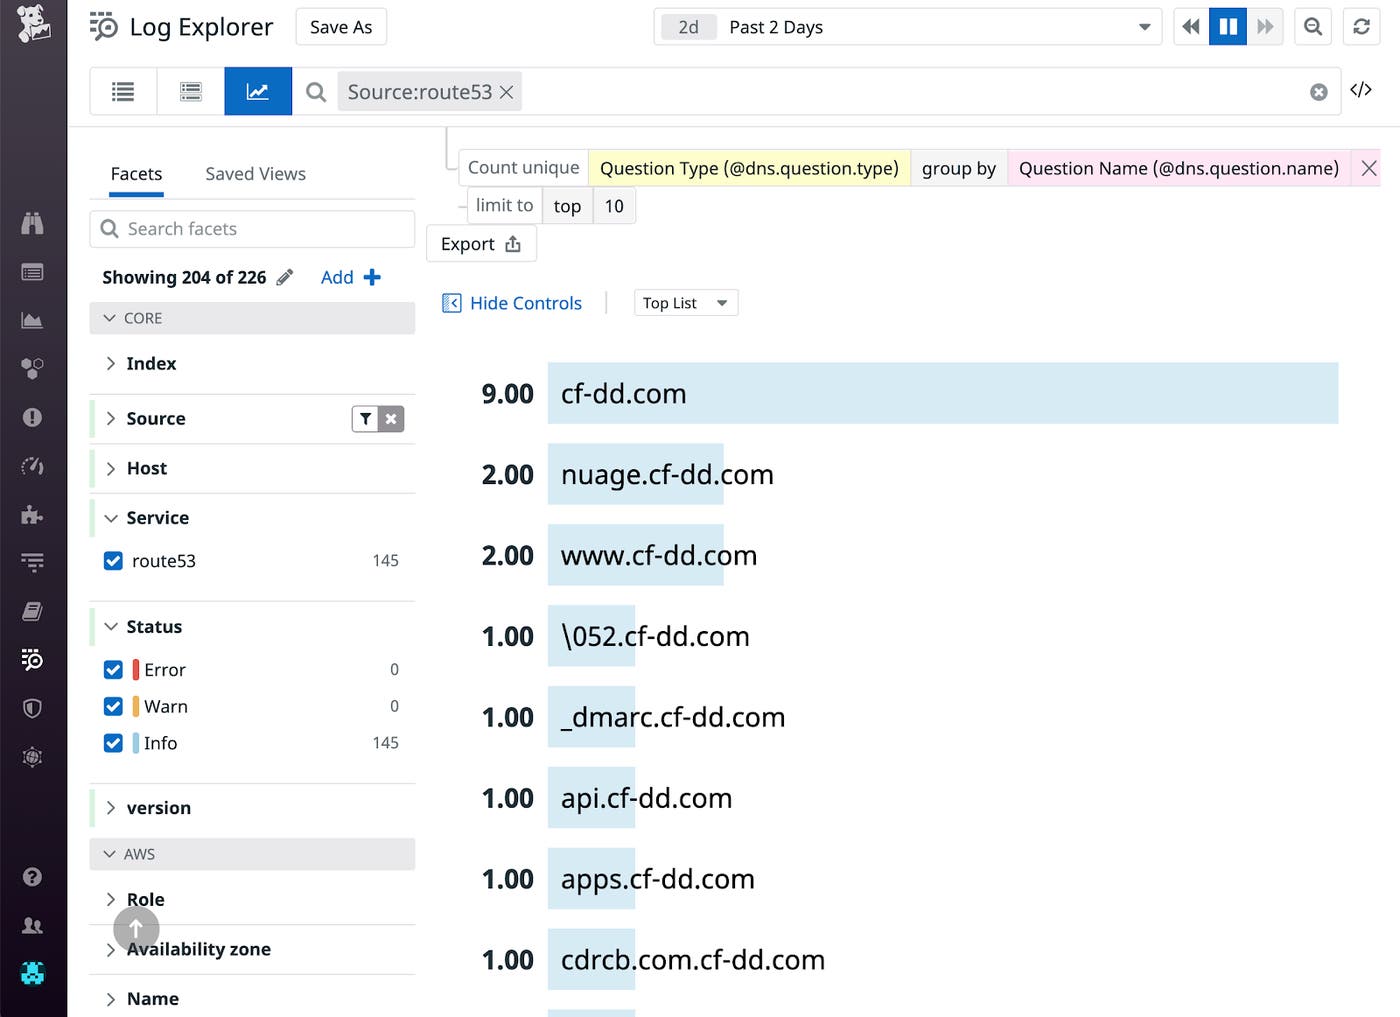
Log Analytics lets you easily aggregate and visualize the data from your Route 53 logs. For instance, you could count your logs by dns.question.type(e.g. CNAME or AAA) and group those counts by dns.question.name to generate a chart that shows the types of DNS records accessed and which domains they belong to.
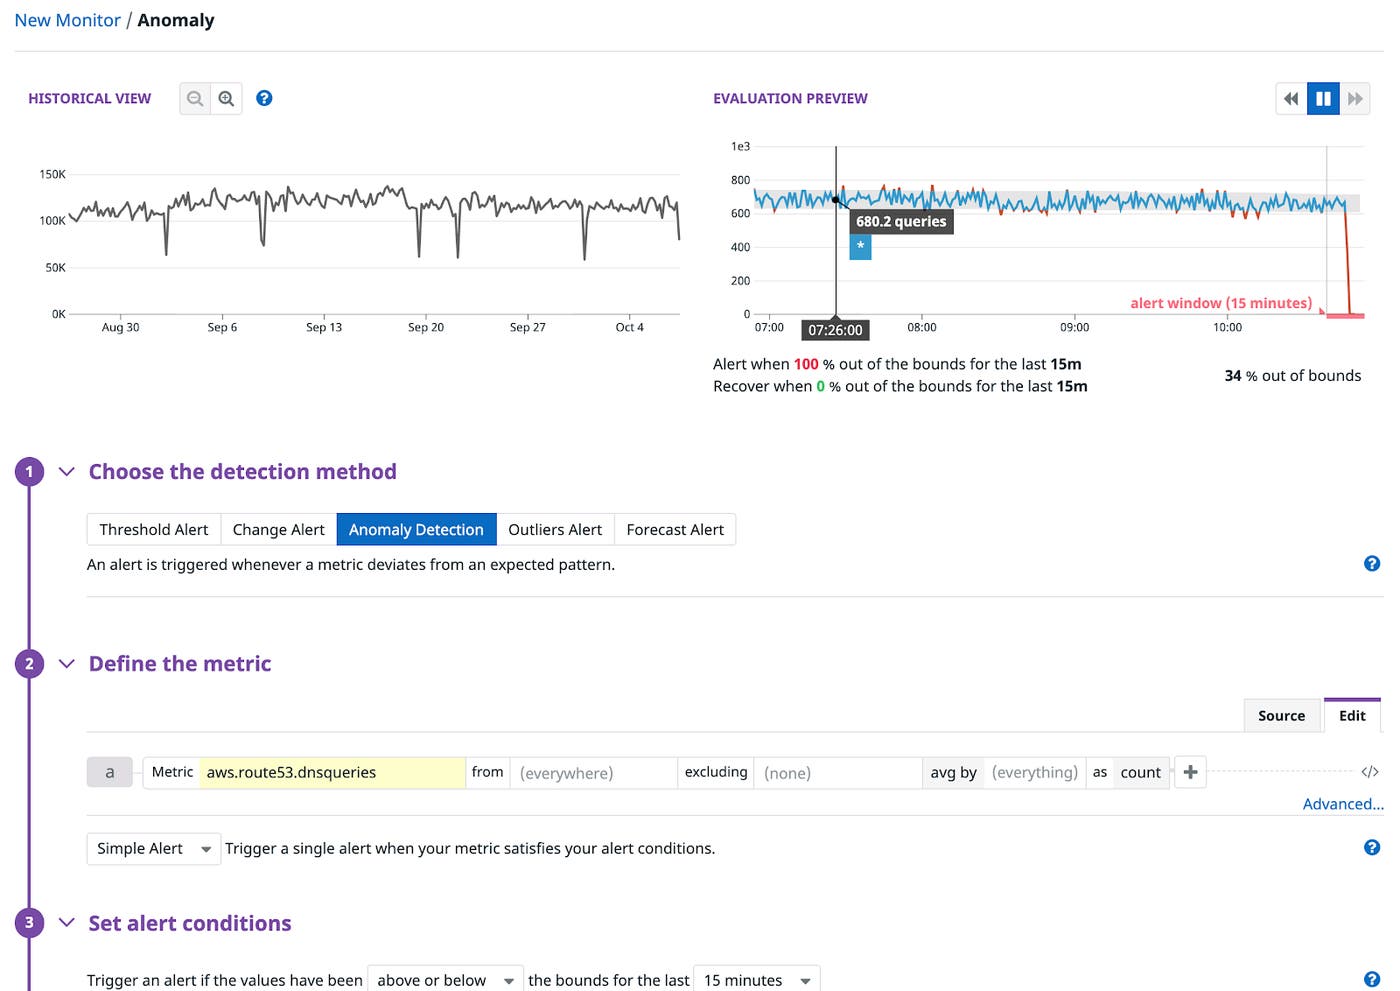
You can also create metrics from your Route 53 logs to visualize and alert on. This lets you easily identify trends in your logs without needing to dig through all of them. You can add any of your log-based metrics as a graph to one of your dashboards, or create an alert to trigger on certain conditions. For example, our algorithmic anomaly detection alert can notify you of unusual behavior depending on past trends, for instance, an increase in DNS errors or a drop in DNS traffic to an endpoint that could indicate operational issues.
Monitor resolver logs for security threats
Route 53 resolver logs record all DNS queries made between Amazon resources in your VPC, providing insight into the ways the different parts of your application are communicating with each other. Since these logs all traffic into and within your network, monitoring them is key to detecting potential security problems.
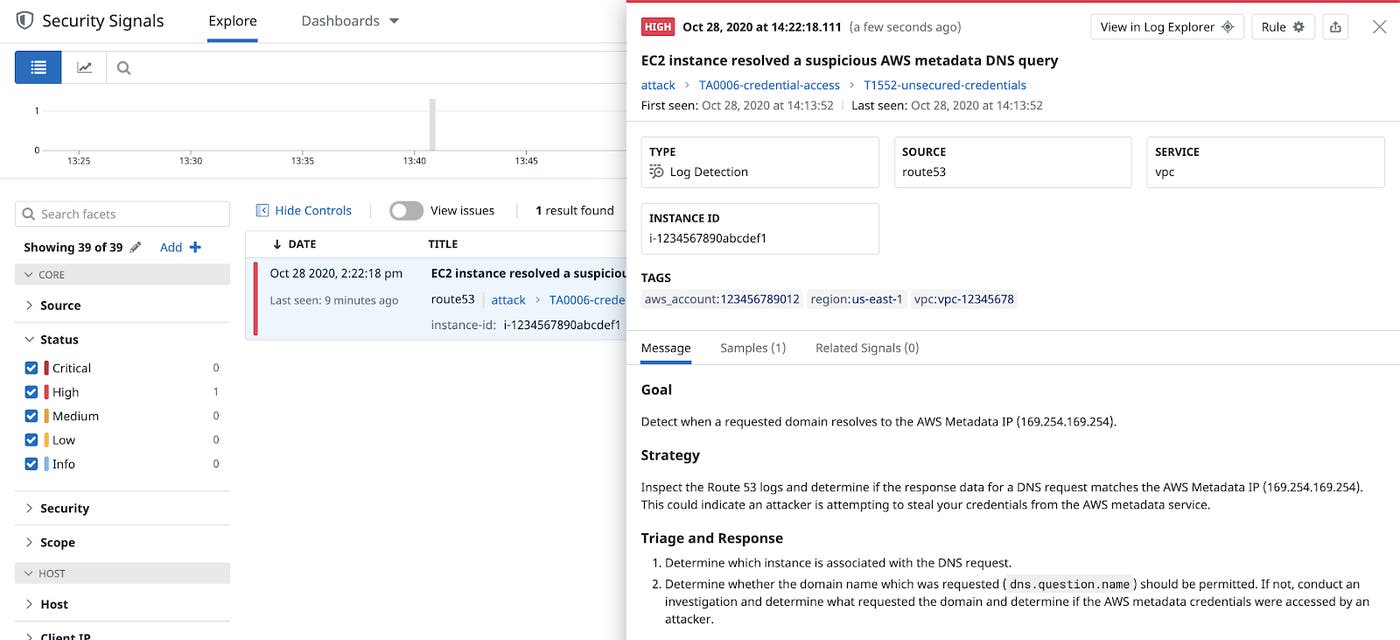
With Datadog Cloud SIEM, you can apply Threat Detection Rules for Datadog to alert you to possible malicious activity in real-time. When a rule is triggered, Datadog generates a Security Signal containing details including context such as relevant logs from the timeframe the event took place.
Datadog provides out-of-the-box rules for Route 53 resolver query logs. For instance, we monitor logs for requests which resolve to the AWS Metadata IP (169.254.169.254). If this address appears in the answers.Rdata array, it could signal an attempt to steal your Amazon credentials from the AWS metadata service.
You can also define your own custom security rules. For instance, you could create a rule to trigger when a request comes from an origin that is known to be malicious. To do this, you add a custom processor to your log pipeline that checks the domain of the original request against a list of bad domains. Set the source attribute to dns.question.name, the key containing the query’s domain name in your Route 53 logs. Then, set the target attribute path to the name you’ll give your custom field—in this case, malicious_domain—that Datadog will assign the true or false value when it processes the log.
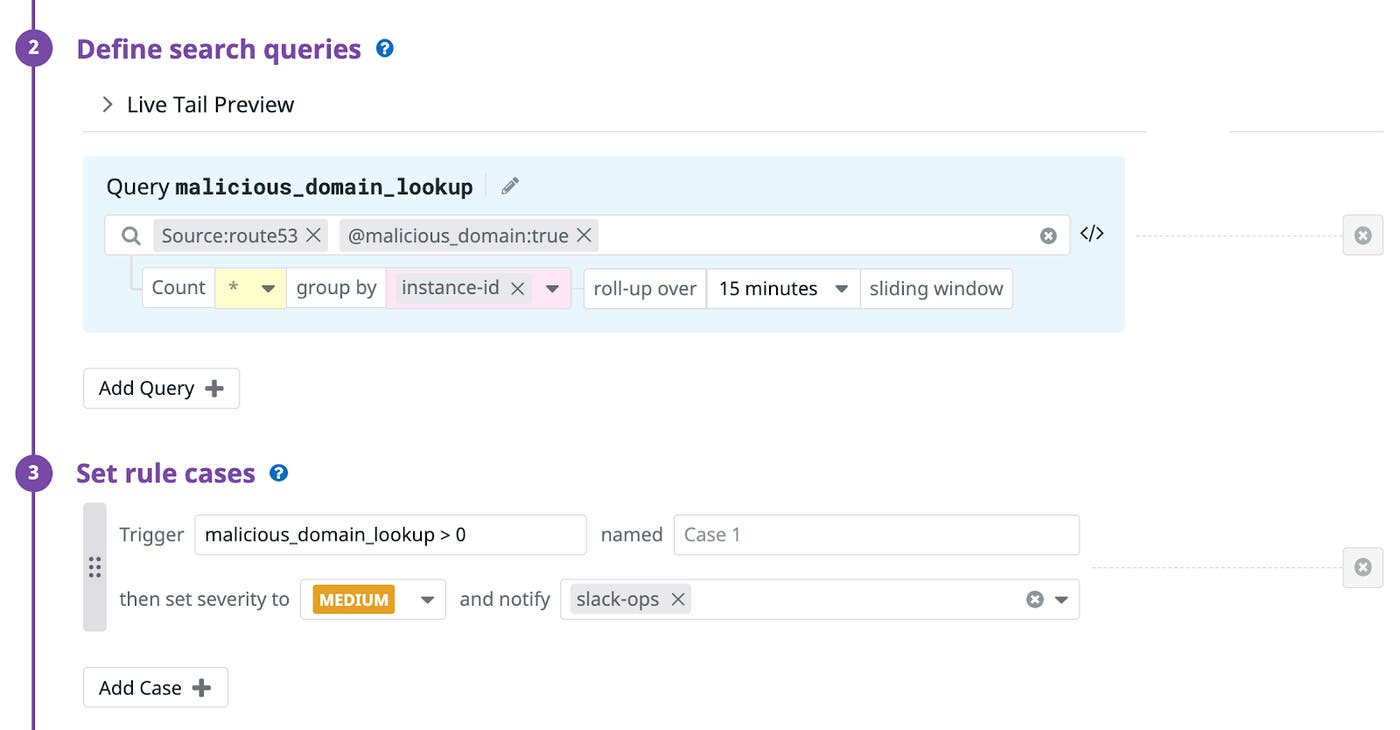
Then, in Cloud SIEM, you can define a rule to alert on the appropriate query. The rule below queries logs from Route 53 that contain the @malicious_ip:true field applied by the above processor, and generates a Security Signal if it returns a non-negative result. Finally, you can also set a severity level, and assign groups to receive notifications, including Jira or Slack channels.
Datadog applies detection rules to 100 percent of ingested logs, even if you decide not to index some of them. With Logging Without Limits™, you can rehydrate archived logs for use in later security audits or investigations.
Start monitoring Route 53 today
Amazon Route 53 emits information about requests to your DNS records that is invaluable when evaluating traffic patterns into and within your network and investigating security threats. Datadog offers all the tools you need to collect Route 53 metrics and logs, perform rich analytics, and alert on suspicious activity. See our documentation to get started. Or, if you’re not signed up with Datadog, start your 14-day trial.

