Bowen Chen
Amazon Bedrock is a fully managed service that offers foundation models (FMs) built by leading AI companies, such as AI21 labs, Meta, and Amazon along with other tools for building generative AI applications. After enabling access to validation and training data stored in Amazon S3, customers can fine-tune their FMs to invoke tasks such as text generation, content creation, and chatbot Q&A—without provisioning or managing any infrastructure.
We’re pleased to announce that Datadog integrates with Amazon Bedrock, allowing you to monitor your FM usage, API performance, and error rate with runtime metrics and logs. In this post, we’ll cover how you can monitor your AI models’ API performance and optimize their usage.
Monitor your AI models’ API performance and errors
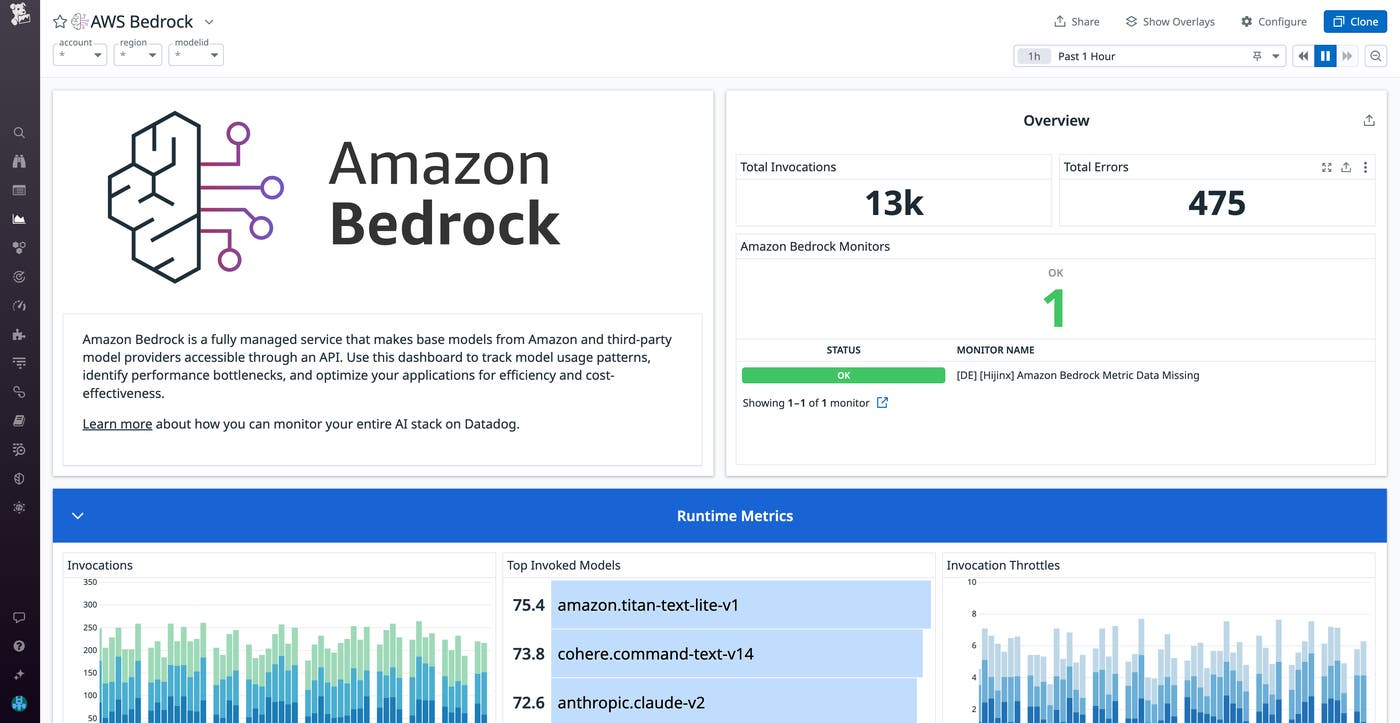
After installing our Bedrock integration, Datadog will begin to collect runtime metrics and logs that help you monitor your models’ API performance. You can visualize all this telemetry data in an out-of-the-box (OOTB) dashboard that gives you a high-level overview into the health and performance of your models, including the number of invocations and errors.
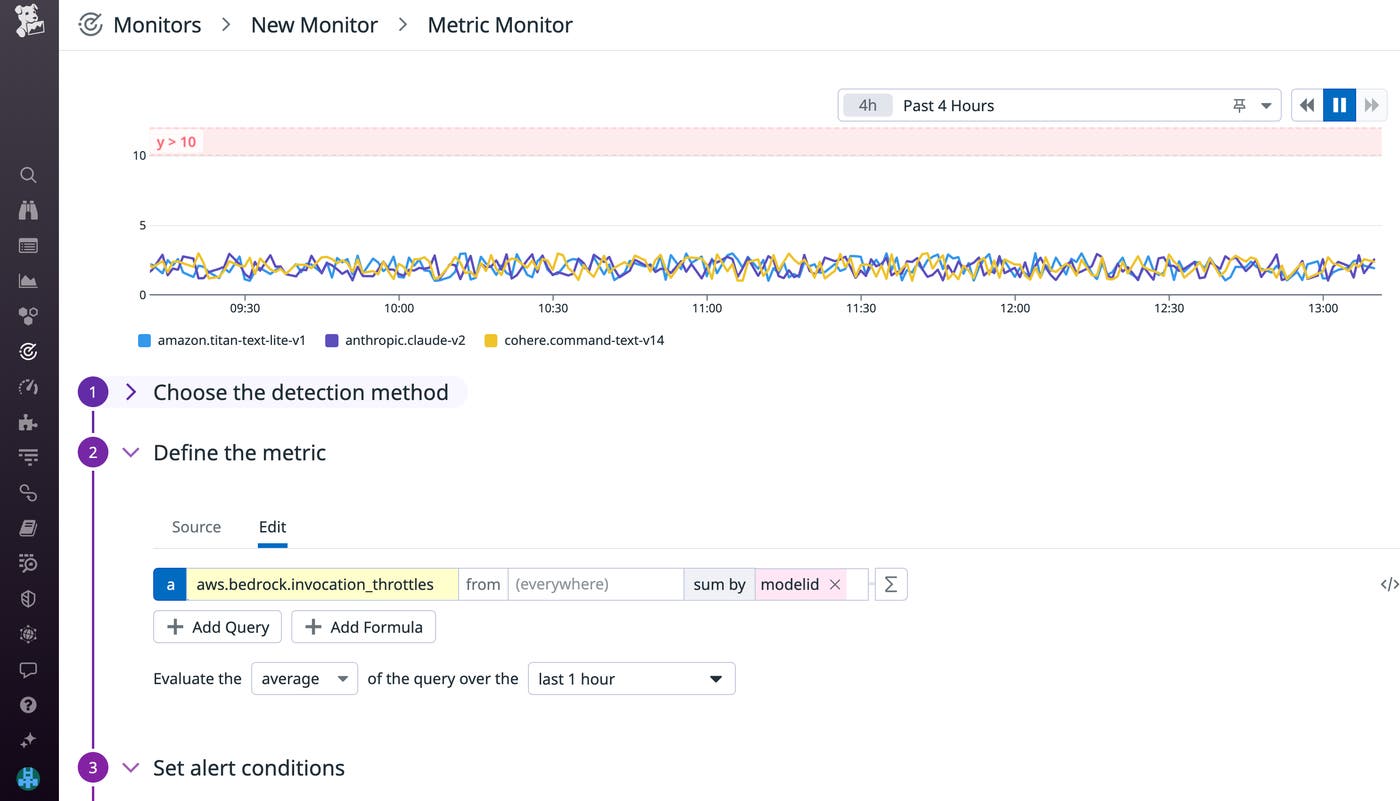
The overview section of the dashboard displays the real-time status of any monitors configured using Bedrock data. For example, you can configure a monitor to notify you about a high number of invocation throttles (aws.bedrock.invocation_throttles). Throttling occurs when a model is unable to process its current load (at which point the model API will deny incoming invocation requests and return a ThrottlingException error). If you get alerted, you can provision additional throughput for your model.
You can also use the dashboard to monitor invocation latency (aws.bedrock.invocation_latency), which can help you detect when your model is slowing down your AI application. Tracking each model’s latency and other performance metrics can help you identify top performers so you can choose the ones that best fit your business needs.
Optimize your model usage
Bedrock metrics collected by Datadog enable you to monitor how frequently your models are invoked by customers and the complexity of data they typically process and generate. This can give you insights into how your customers are using your AI products and opportunities to optimize your model usage. You’ll want to track the aws.bedrock.invocations metric for each model, which measures how often customers are invoking a model via its API endpoint.
Monitoring your models’ input token count (aws.bedrock.input_token_count) and output token count (aws.bedrock.output_token_count) metrics can help you verify that your models are being used as intended. When your model receives an input (e.g., a customer asking Bits AI, “how do I configure a monitor?”), the input data is broken down into smaller units, also known as tokens, that the model processes to generate an output. The input and output token count metrics measure the number of base token units for each processed input and generated output, respectively. They can help you gauge the complexity of the inputs your model handles and generates. For instance, a longer prompt is typically more complex—and generates or consumes more tokens—than one that is shorter.
Models are equipped to handle a fixed context window (measured by token count). This refers to the amount of key context it can store as short-term memory within an interaction—e.g., if you’re using Bits AI to troubleshoot an issue, new responses will retain context of previous questions you’ve already asked up to its context window limit. If you notice that your model’s output token count is higher than expected, it may risk exceeding the context window for its expected use case. As a result, if your token count metrics fall outside of your expected bounds, you may need to reevaluate your training and validation data or model parameters.
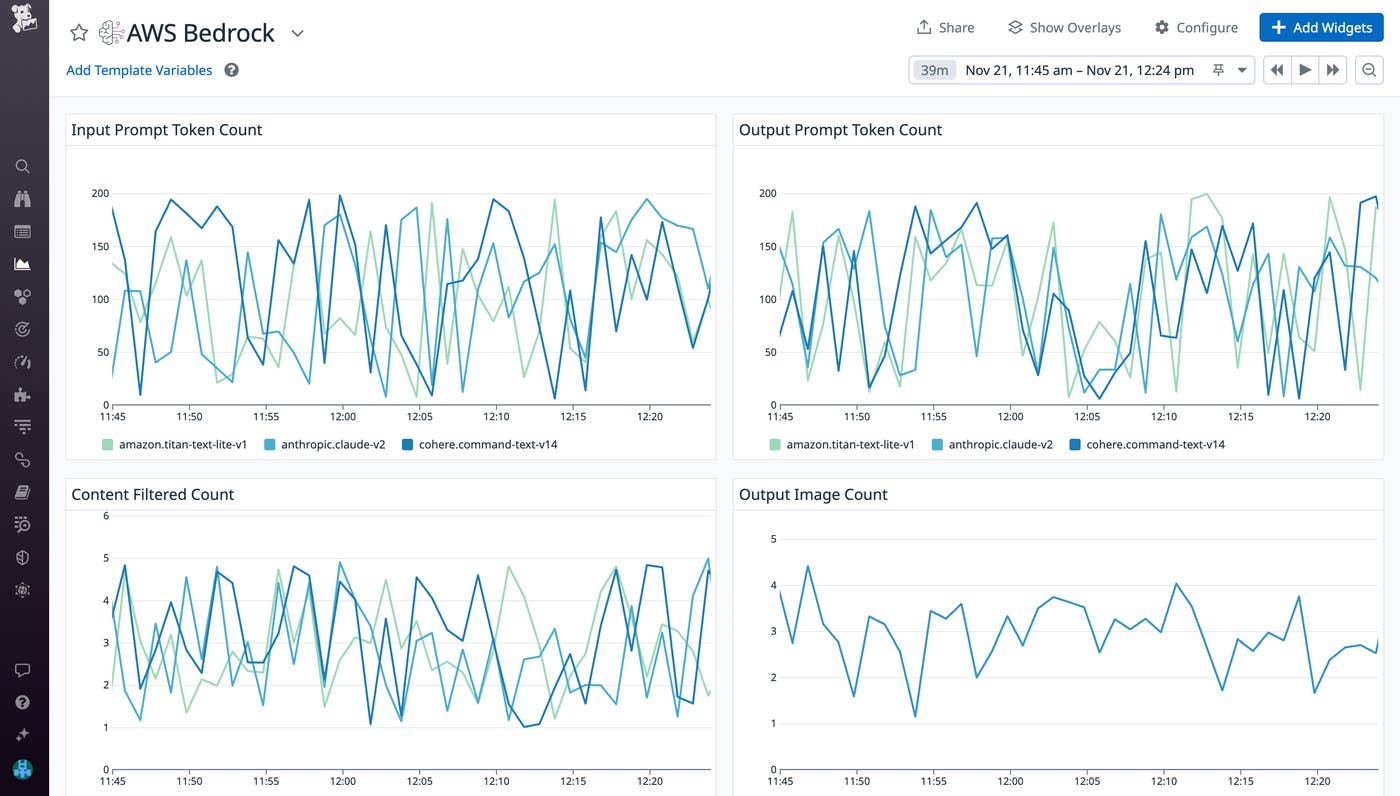
Token count is also important when allocating resources to your models. If you have configured Provisioned Throughput, each model will be able to process and generate a fixed hourly number of tokens. However, provisioning won’t always align linearly with its number of invocations. A model that handles a large number of invocations—but is used for processing shorter prompts or returning short responses—may not require as much throughput as a model that is invoked less frequently but handles higher-complexity inputs. For popular models that are invoked the most frequently (or handling more complex inputs), you’ll want to provision more throughput to enable faster processing and return times. Conversely, if certain models are being invoked less frequently (or handling shorter inputs) than expected, you can adjust their provisioned throughput to lower costs without impacting performance.
Get insights into model prompts and responses with logs
In addition to metrics, our integration enables you to monitor Bedrock API calls via CloudWatch logs, which are also displayed in the OOTB dashboard. Once you’ve enabled log collection from the Bedrock console and configured our integration to collect those logs, you can gain deeper insights into your customers’ queries and how your models respond. Without these logs, it can be very difficult to qualitatively gauge what actual users are querying and how your large language models (LLMs) are responding. You can use this data to analyze whether the real-world usage of your model aligns with its training/validation data and fulfills its intended purpose. Logs also enable you to perform qualitative analysis on customer prompts—such as how often they use certain key phrases or ask questions about a specific product. Doing so can help you identify onboarding pain points for certain products or common issues customers run into that your product teams may have overlooked.
Get started with Amazon Bedrock and Datadog
With Datadog’s Amazon Bedrock integration, you’ll be able to monitor the usage and performance of the APIs that drive the development of your generative AI products. To learn more about how Datadog integrates with Amazon machine learning products, you can check out our documentation or this blog post on monitoring Amazon SageMaker with Datadog.
If your organization uses LLMs and other generative models, Datadog LLM Observability can help you gain deeper visibility into your models and evaluate their performance. Using LLM Observability, you can quickly identify problematic clusters, model drift, and prompt and response characteristics that impact model performance. To get started, sign up for our Preview.
If you don’t already have a Datadog account, you can sign up for a free 14-day trial today.


