

Akamai is one of the world’s largest CDN solution providers, helping companies greatly accelerate the secure delivery of content to their users all across the globe. Akamai provides this content delivery through its Intelligent Edge Platform, which is made up of hundreds of thousands of edge servers distributed around the planet. Given this vast size and the complexity of delivering content to millions of users globally, identifying performance bottlenecks in your organization’s CDN can be challenging.
To help you overcome this challenge, Datadog integrates with a variety of Akamai’s visibility tools, including Datastream and mPulse, enabling you to gain insight into the health and performance of your CDN. Today, we’re pleased to announce that Datadog now also integrates with Akamai Datastream 2. Datastream 2—which will fully replace Akamai’s original Datastream product later this year—is a low-latency API service for log delivery. Specifically, Datastream 2 captures raw performance and security logs from the edge servers that send content to your end users and then streams those logs to a destination of your choosing. You can learn more about Akamai’s shift from Datastream to Datastream 2, and some key differences between the two, here.
In this post, we’ll look at how you can use our integration to send Datastream 2 logs to Datadog, providing you with visibility into key performance indicators such as request traffic, HTTP response codes, and more.
Visualize Datastream 2 logs
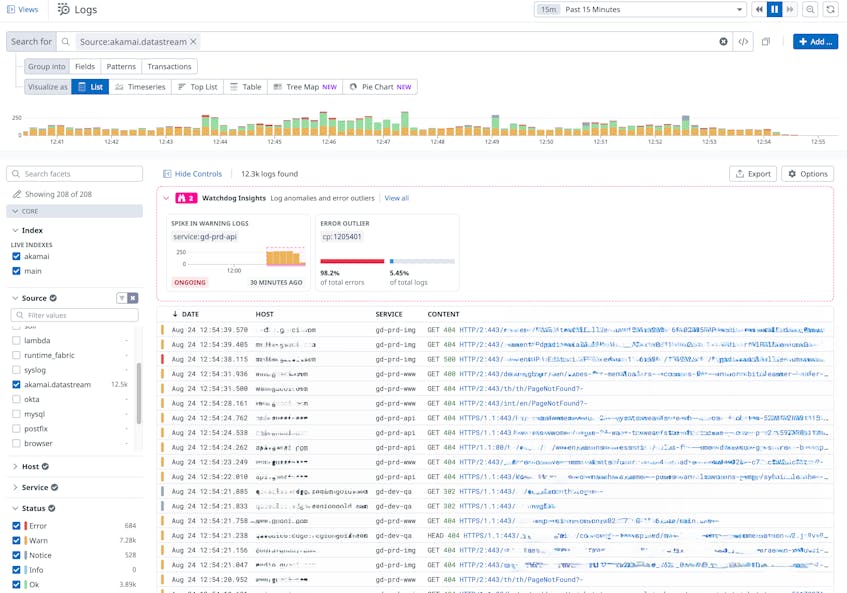
Once you set up the integration, Datastream 2 logs will stream to Datadog and be viewable in the Log Explorer, where you can search and filter logs to help aid your troubleshooting. For instance, you can use the Log Explorer to search for any incoming Datastream 2 logs containing errors from the last 15 minutes to help you spot issues that have occurred recently.
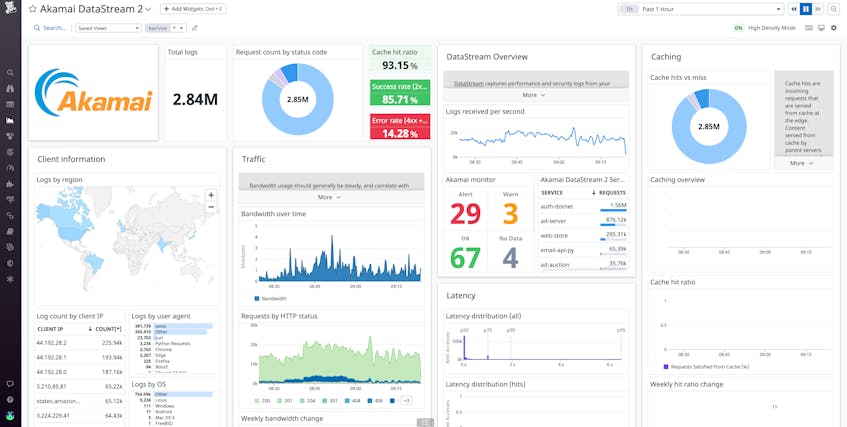
Datastream 2 logs will automatically populate a customizable out-of-the-box dashboard, so you can quickly get insight into key performance indicators such as latency, cache hits and misses, and HTTP status codes.
For additional visibility into Datastream 2 health and performance, you can use Datadog’s log processing and analytics to generate new log-based metrics that can be added to the OTTB dashboard.
Quickly spot performance issues
Centralizing logs and metrics together in a single dashboard provides you with an overview of your CDN’s performance, helping you spot issues quickly. For example, the dashboard can help highlight an underwhelming cache hit ratio, which is an indication of poor CDN performance. Akamai uses caching—storing content in edge servers located closer to end users—to lessen the load on your origin servers and deliver content at a reduced latency. If caches aren’t serving clients efficiently, it’s a sign that the overall performance of your application has degraded, which in turn can negatively impact customer satisfaction and thus your bottom line.
The Datastream 2 dashboard is pre-configured with formatting rules that will turn the “cache hit ratio” red if it drops below 65 percent, a threshold indicating that caches are not efficiently fulfilling client requests. If your cache hit ratio is lower than expected, you likely need to reconfigure your cache control settings.

Get started today
Datadog’s Akamai Datastream 2 integration collects and visualizes key logs to help you ensure that your CDN is performing as expected. With more than 750 available integrations, Datadog enables you to monitor Datastream 2 logs alongside telemetry—such as real user monitoring (RUM) metrics from mPulse—from all across your web stack.
What’s more, with Flex Logs—which enables cost-effective long-term analysis and on-demand querying of high-cardinality datasets—Datadog provides a storage solution excellently suited to CDN logs, since they are typically high in volume and queried mainly on an ad hoc basis.
To learn more about our Datastream 2 integration, please read our documentation. To keep track of new features on Datastream 2, you can review their changelogs here.
If you aren’t already a Datadog customer, get started with a 14-day free trial .
