John Matson
“What does this metric actually measure?”
“Are these latency numbers in milliseconds or microseconds?”
When you’re diagnosing an issue in production, you don’t want to spend time answering questions like these to decipher your metrics.
To eliminate ambiguity and help you make sense of your systems as quickly as possible, we’ve rolled out a comprehensive metadata catalog covering standard metrics collected by our supported integrations. This catalog supplies measurement units and a brief description for approximately 3,000 metrics, which surface automatically on your graphs and dashboards.
Metadata on your dashboards
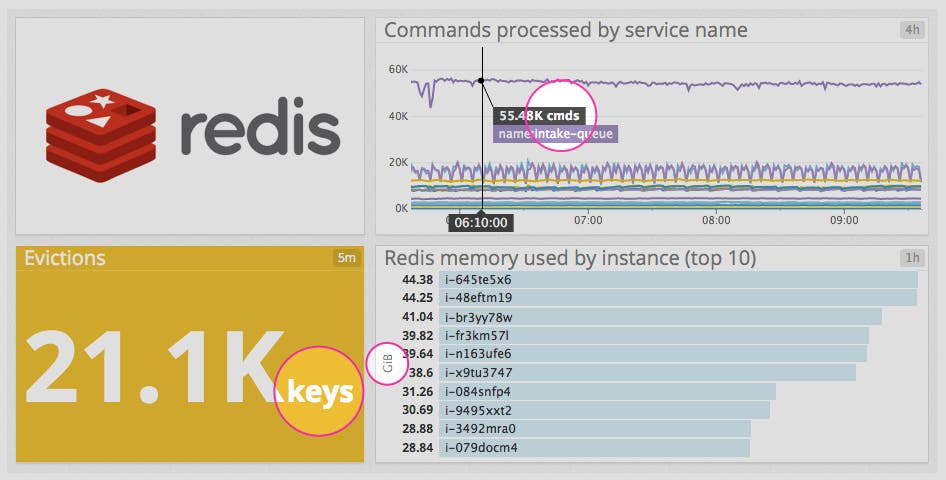
You may have already noticed metric metadata appearing on your dashboards. Units are displayed automatically on timeseries graphs, query value widgets, and toplists, as shown in the screenshot of a Redis dashboard above.
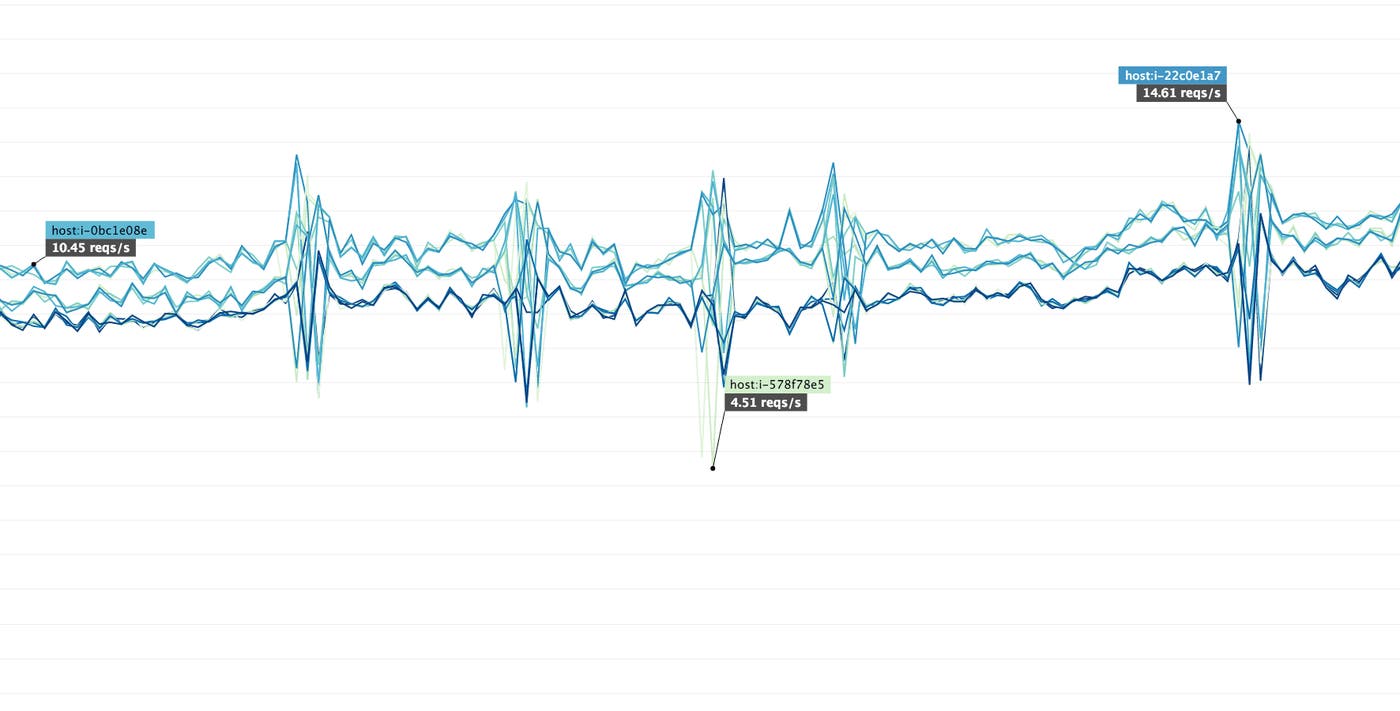
On timeseries graphs, just move your cursor over any graph to see the relevant units. The raw data is automatically converted to easily readable display units (fractions of a second to ms, millions of bytes per second to MiB/s, etc.).
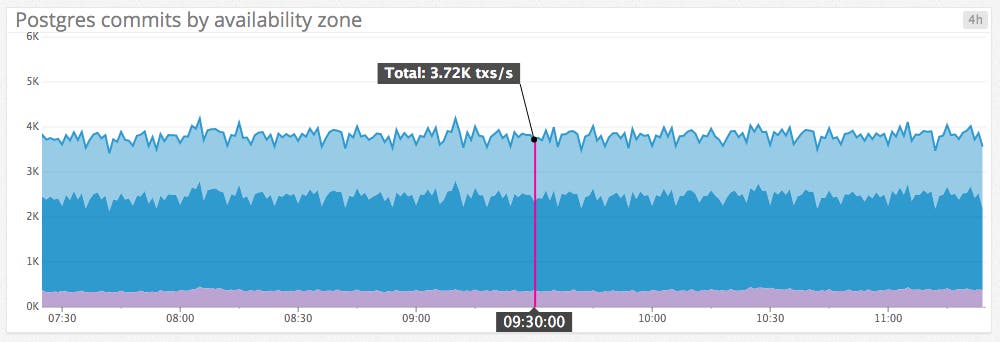
Units are also displayed at the bottom of timeboard graphs, and metric descriptions are available by selecting “Metrics Info” from the gear dropdown.

Metadata for your reference
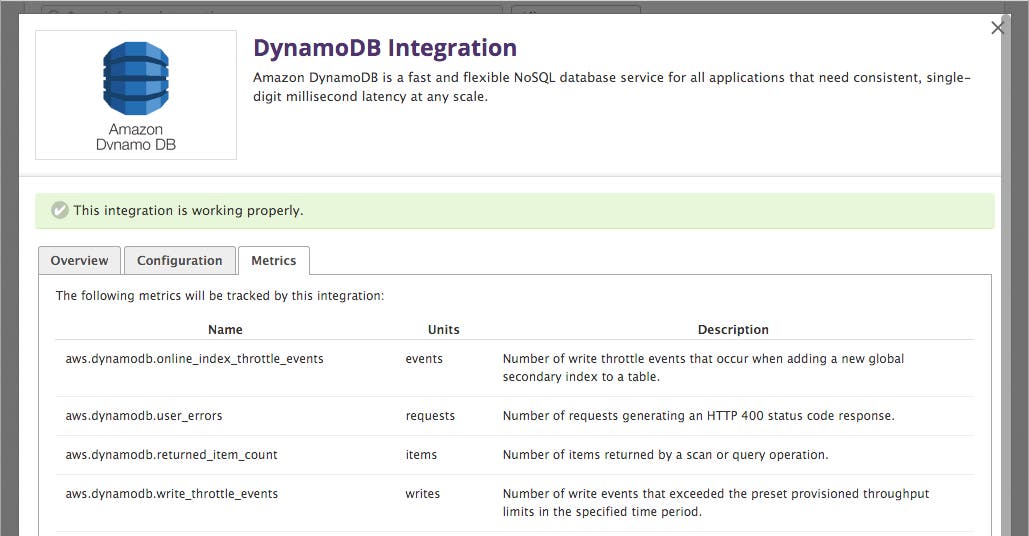
You can find a complete list of collected metrics, their units, and their descriptions under the new “Metrics” tab for integrations in the Datadog app. The same per-integration breakdown is available in the docs as well.
Let’s get meta
If you’re already a Datadog customer, measurement units and metric descriptions are now available for all your standard integrations.
If you don’t yet have a Datadog account, you can get a full-featured 14-day trial here.
