Abril Loya McCloud
As your organization scales up, the number of applications, services, and other components to monitor scales with it. In a large organization with hundreds of services across dozens of teams, you’ll likely have more monitors set up than you can easily scroll through. To make it easier for teams and organizations of all sizes to find, filter, and organize all their monitors, we’re excited to announce a new Manage Monitors UI in Datadog.
Filter, search, explore
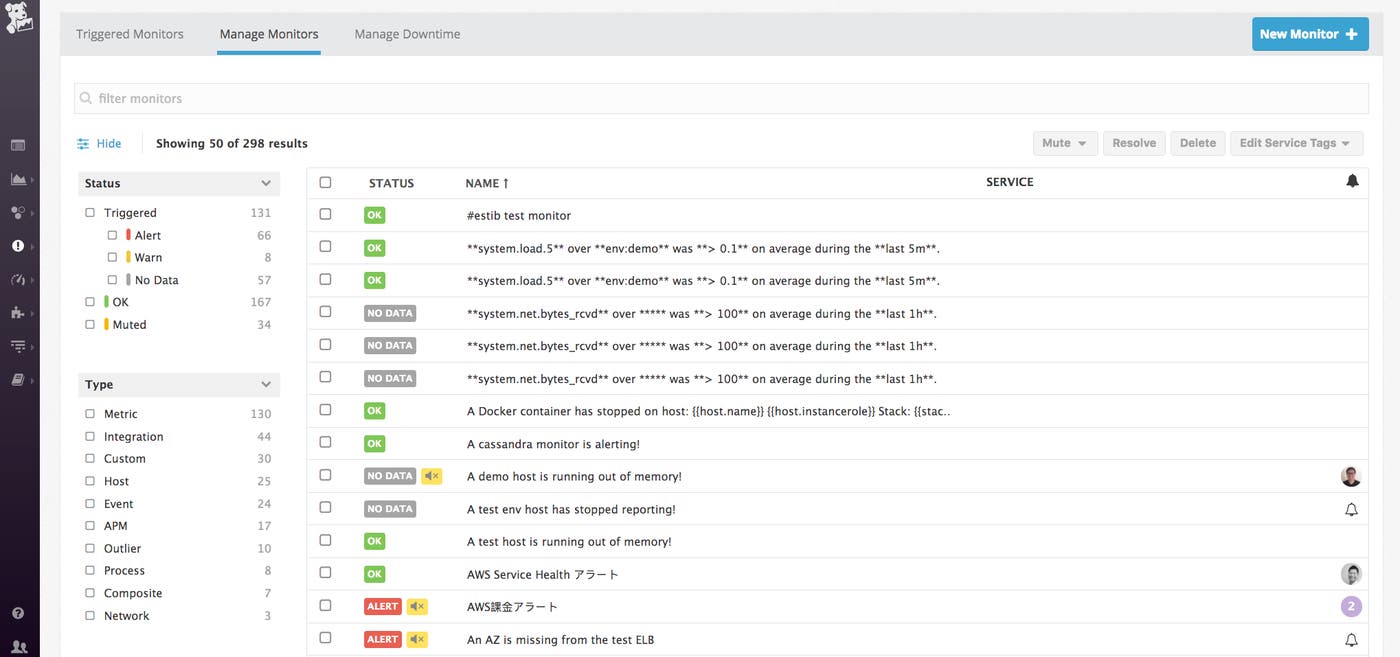
When you get paged, you need a fast and frictionless way to find the information that will inform your incident response. So we have added a new sidebar to the monitor management page that allows you to quickly filter on the different dimensions and attributes of your monitors. This format allows you to filter for monitor tags and conditions with just a few clicks. For example, you can quickly isolate which outlier-detection monitors on Cassandra have triggered alerts, just by clicking on a few buttons in the UI.
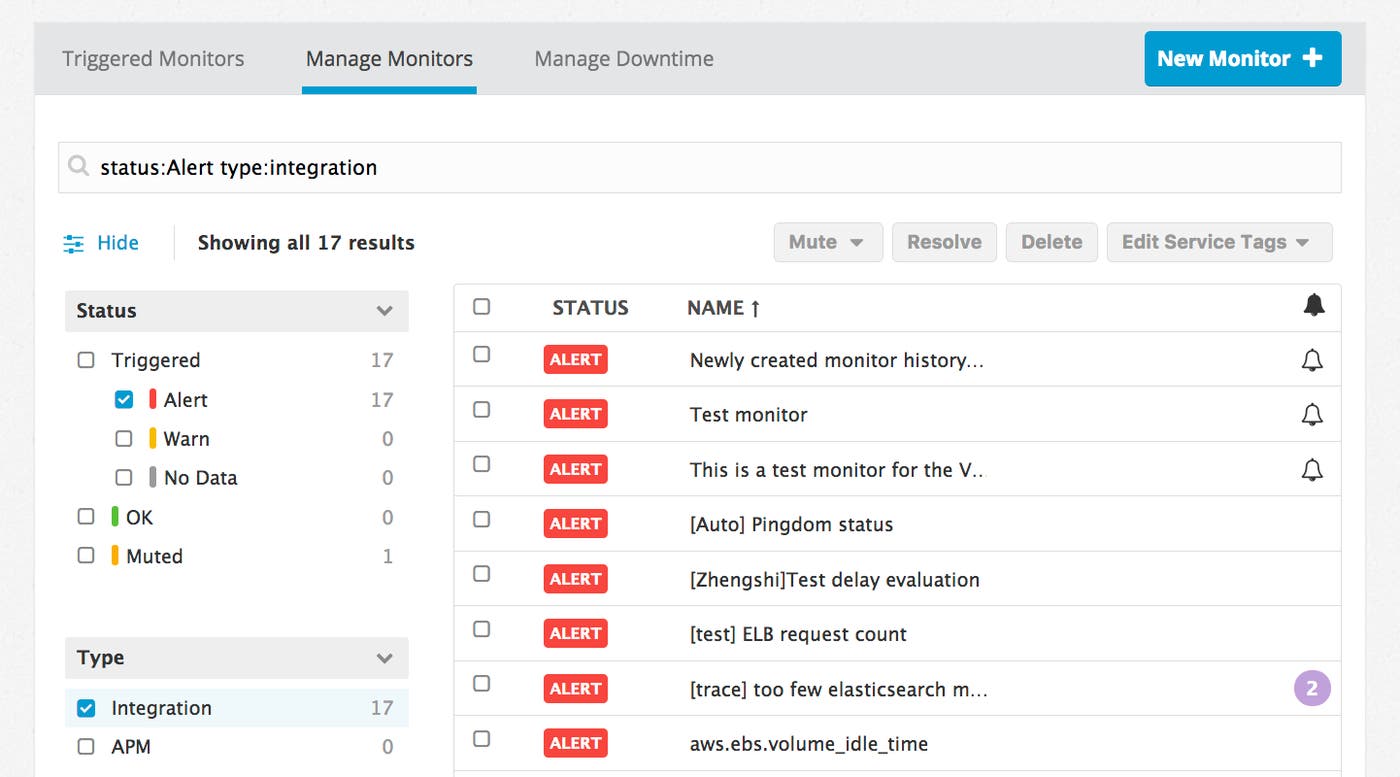
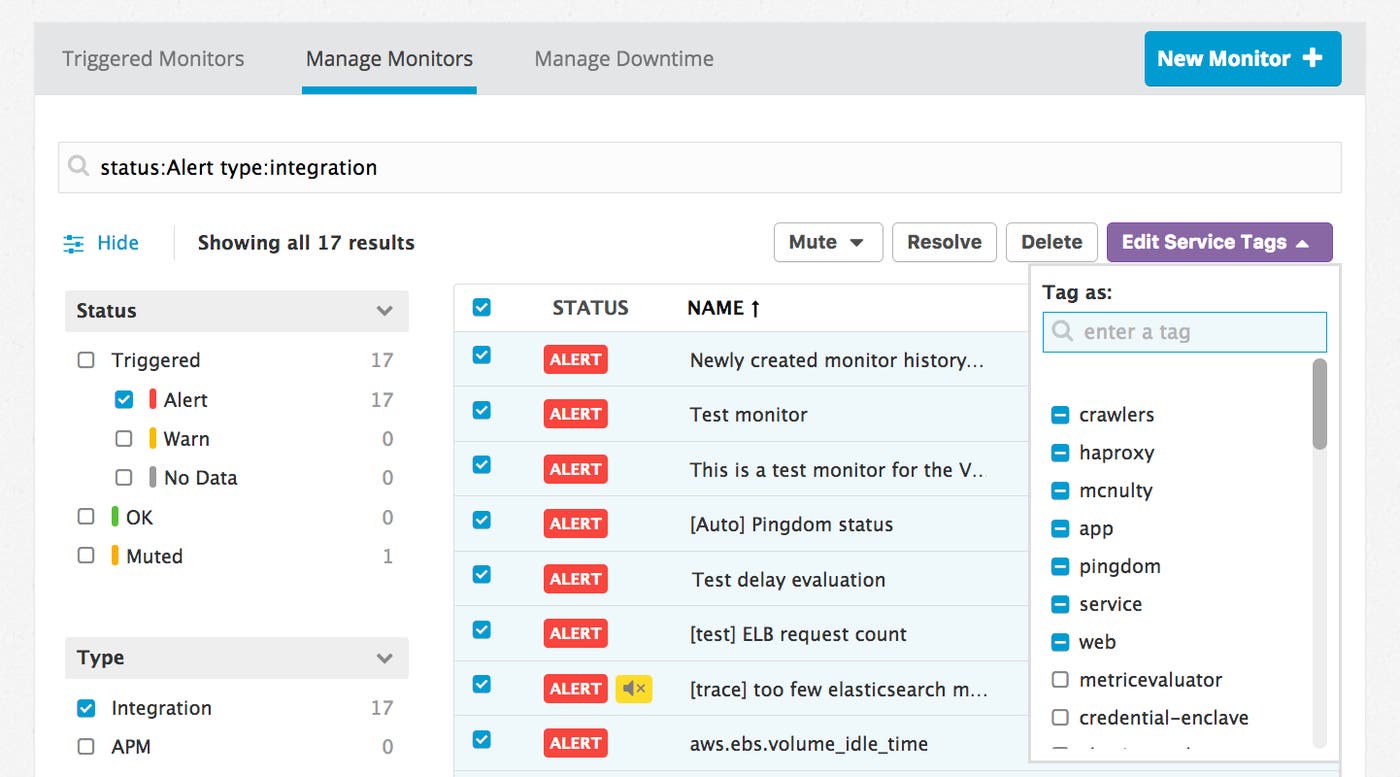
We are also introducing advanced monitor search to make your monitor queries faster, more precise, and more powerful. You can use the search bar to locate monitors by monitor name or other attribute (e.g. status:alert type:integration). Faster searches mean you’re able to quickly drill down to discover which parts of your infrastructure are having issues.
The new page is also faster than ever. Organizations with large numbers of monitors will see the biggest improvements, but page load times are dropping for everyone.
Monitor coverage at a glance
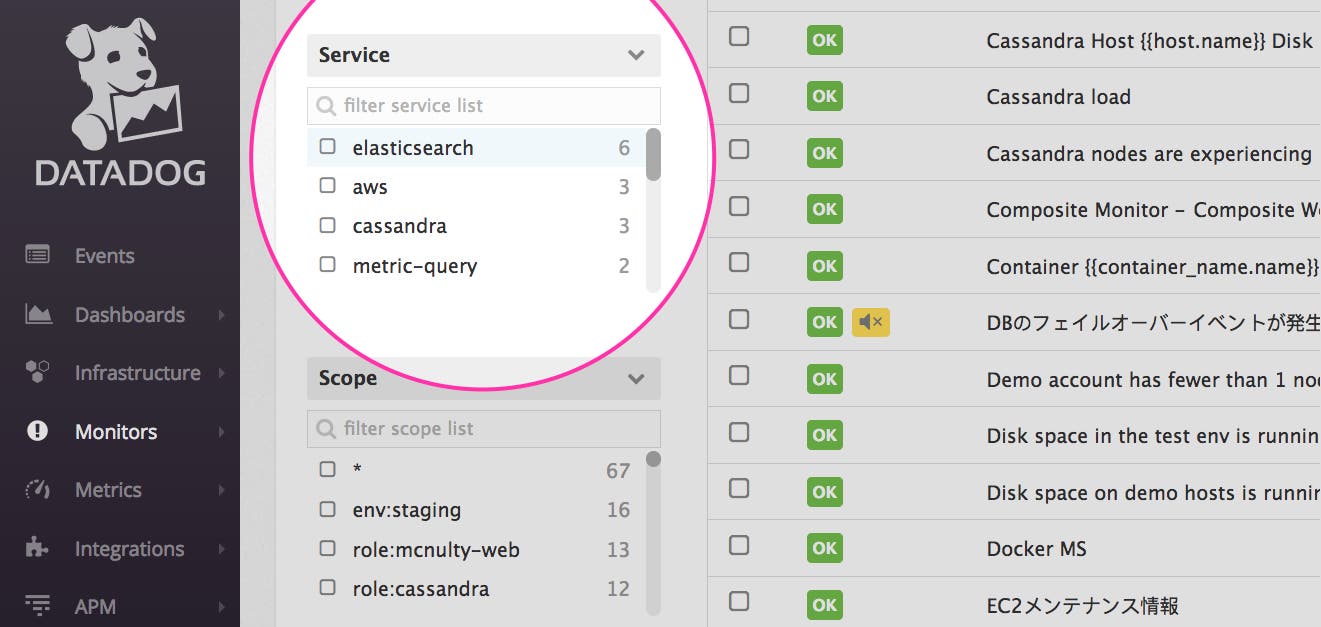
Searching and filtering doesn’t just provide context for your alerts—it helps you understand your coverage better. For every monitor search, you get ranked lists that break down the results by service, monitor type, notification channel, and so on.
Better organization with multi-edit
We recently introduced service tags for monitors, allowing you to tag your monitors with the names of associated services. Today, in the new Manage Monitors page, we’re adding multi-edit to make it easier to tag several monitors at once, as well as apply other bulk operations like muting and resolving. Coupled with our new search and filter functionality, you can find exactly the monitors you want to edit and apply those changes easily.
Built for teams, built for scale
Whether you have multiple teams and lots of monitors, or you simply want the flexibility to sort and filter your monitors on the fly, the Manage Monitors page provides a simple and intuitive way to see what is happening, and where.
If you are an existing Datadog customer, the new Manage Monitors page is already available to you by clicking on “Manage Monitors” in the Monitors section of the navigation sidebar. Otherwise, you can sign up for a free Datadog trial to see how sophisticated alerting and collaboration can help your teams to identify and resolve issues faster.

