
Logs are an invaluable source of information, as they provide insights into the severity and possible root causes of problems in your system. But it can be hard to get the right level of visibility from your logs while keeping costs to a minimum. Systems that process large volumes of logs consume more resources and therefore make up a higher percentage of your overall monitoring budget. Further, log throughput can be highly variable, creating unexpected resource usage and financial costs. On top of that, logs that are useful in some situations lose their value in others.
In this post, we’ll show you how to implement log management policies that effectively address all of these challenges. We will explain how to answer four key questions to establish log management policies with your teams:
- What is the most appropriate storage solution?
- How long should your logs spend in different kinds of storage?
- Are there logs that you only need at certain times?
- Are there logs that you need only as aggregates or samples?
We’ll also show you how Datadog makes it straightforward to address these questions, and to change your policies on the fly.
But first, we’ll discuss how to prepare your organization to adopt sustainable log management policies by centralizing logs and setting up log management budgets with your teams.
Prepare your teams to implement log management policies
Before you can implement policies in response to these questions, you will need to centralize your logs, set up log management budgets with your teams, and empower them to follow these budgets while still getting all the answers they need from their logs.
Centralize your logs
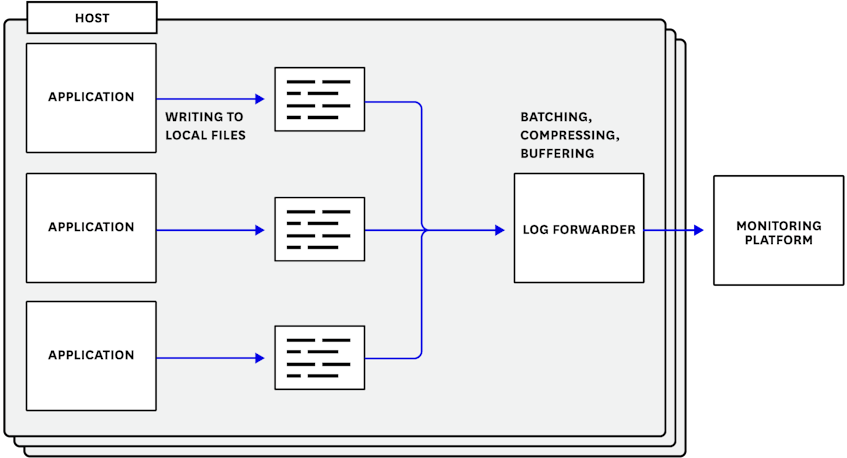
The first step toward implementing a log management policy is to use a log forwarder. Not only will this centralize all of your logs in one place for better accessibility and observability, it also gives you and your teams a vantage from which to control your log throughput using log management budgets (as we’ll introduce next).
In this setup, your applications write logs to the local filesystem, and the log forwarder tails your log files and sends the logs to a monitoring platform for processing, visualization, and analysis. The forwarder will take care of any batching or compression, and can retry submissions without holding up your main application. (For more information on forwarding logs from your applications, see our logging guides for PHP, C#, Java, Python, Rails, and Go.)
Meanwhile, your log files can act as a failsafe buffer. If an application crashes or a host becomes unavailable before sending all of its logs to your monitoring platform, the forwarder can submit them again after recovery.
Set up log management budgets with your teams
If you are overseeing log management for your engineering teams, you need to define a clear budget for each of them. Otherwise, it will be difficult if not impossible to ensure that your teams are processing logs at a sustainable level for your infrastructure or your organization as a whole. We encourage you to define a budget that sets concrete and actionable guidelines for each team, so that they can adhere to those requirements.
If your organization relies on a third-party log management solution, you are accountable for how much money you’re spending on that service. If your organization hosts its own log management solution, you are accountable for resources devoted to logging: CPU utilization, disk space, bytes sent over the network, or the number of engineers who operate and maintain your logging-related infrastructure.
But regardless of whether your organization hosts its own log management solution or relies on a third-party service, you should define your budgets in terms of a metric such as gigabytes of log data or millions of log lines per month. This way, it will be directly actionable for developers.
However, it can be tricky to set budget thresholds for your chosen metrics. For example, one team might be able to afford 10 times its average monthly log management budget over a short period of time if it means addressing a critical outage or conducting an annual system audit. You can accommodate temporary spikes in log processing by defining green, yellow, and red thresholds. For instance, your team could set a budget of 1 billion log lines per month on average, while leaving some room for flexibility (e.g., you can go up to 100 million lines per day but you should never spike over 10 MB per second).
Even if the metrics and thresholds you set do not fit the needs of your teams exactly, any empirically supported log management budget is a good starting point for discussion. You can periodically revisit each team’s budget and make improvements iteratively over time.
How to set the right log management policies for your teams
Once you have determined sustainable log management budgets, you will want to onboard your teams. Getting consent from your teams to follow their log management budgets requires more than asking, “Do you need all of these logs?” (The answer will likely be “Yes.”) This is why we encourage managers to ask the following open-ended questions when implementing log management policies.
What is the most appropriate storage solution?
Storage solutions exist on a continuum between hot and cold. The hotter the storage, the better the query performance, but the more system resources—and money—it uses. To successfully implement cost-effective log management policies, you need to choose the correct type of storage for your logs, based on two main factors: how often you need to access those logs and how you plan to query them.
Cloud providers offer low-cost “cold” storage solutions that allow you to store large volumes of logs over a long period of time—at the expense of slow retrieval times. On the opposite extreme, you could use a low-latency block storage service (e.g., Amazon Elastic Block Store) plus database tables with well-designed indexes for higher query performance. However, hot storage comes at a higher cost.
How hot your storage should be depends on what kind of logs you process. Logs suited for hot storage are useful during complex investigations, when you need to be agile and responsive, and can’t plan your queries in advance. For example, error and audit logs are necessary for resolving incidents and maintaining availability, so you probably need to send them to hot storage. This ensures that during an investigation, teams will be able to query these logs at a high volume—and at low latency—as they figure out the scope of an incident.
While you can keep logs in cold storage at a lower cost, this type of storage returns logs at a higher latency. This is either because cold storage responds less quickly to queries or because it requires an initial setup period—e.g., moving logs to hot storage—before you can access your logs.
Cold storage is appropriate for logs that teams can tolerate accessing at this higher latency. For example, if you’re storing customer support logs at the INFO level along with customer reference numbers, you can predict in advance that you’ll retrieve those logs using a reference number and date range. Since you won’t need to iterate from the results of one query to the design of the next, higher-latency (i.e., cold) storage is a good fit.
How long should your logs spend in different kinds of storage?
To help your teams stay within their log management budgets, you should work with them to define and implement retention periods for logs in cold as well as hot storage.
For example, logs from a CI/CD pipeline only need to remain in hot storage for a very short period of time (e.g., the day the pipeline ran), in case teams need to use them to troubleshoot a deployment. Once another deployment takes place, however, these logs likely become obsolete.
On the other hand, error logs should remain in hot storage for a couple of weeks. Error logs are usually less numerous than lower-severity logs, giving them less of an impact on your budget. And since error logs are more explicit about the nature of an issue, they are particularly valuable for troubleshooting.
Organizations often need to follow various compliance regimes, and many of these require that you retain certain logs for a specific period of time (e.g., 13 months). You should keep these in cold storage for maximum resource efficiency, though check with your compliance or legal teams to be sure.
If you are investigating incidents long after the fact, or carrying out an infrequent system audit, it would be reasonable to store these logs in cold storage. Some monitoring services allow you to temporarily warm up logs that have been archived in cold storage so you can access them for a specific use case.
Are there logs that you only need at certain times?
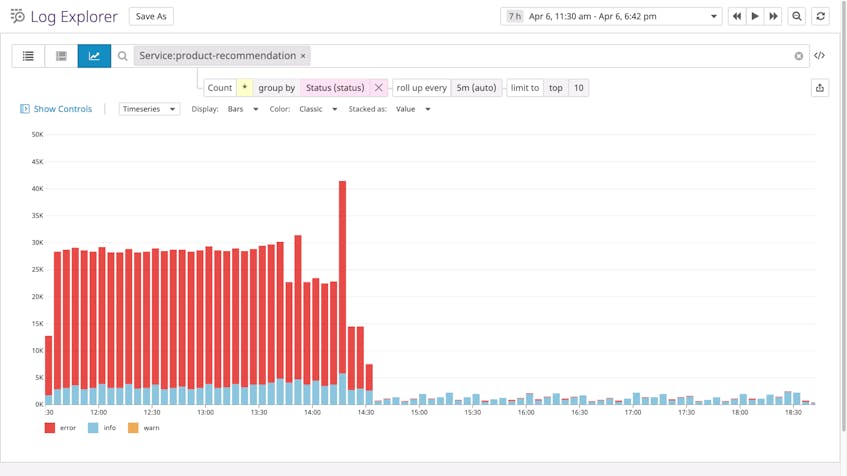
Your teams can reduce their log throughput by identifying logs that they only need under some circumstances. Some logs, such as DEBUG logs, are useful during—and only during—an active investigation. When you need low-latency queries into certain logs, you should “switch on” hot storage for these logs. After the investigation, you can switch hot storage off again.
For example, when a service is undergoing an outage, you can temporarily send DEBUG logs to hot storage, allowing you to use them to investigate potential root causes. Logs at the DEBUG level can also be invaluable when you need full visibility into a database migration or application deployment. But when all services are running as expected, you can resume sending DEBUG straight to cold storage again.
Are there logs that you need only as aggregates or samples?
Another way you can guide your teams toward reducing their average log throughput is by helping them determine which logs they’ll be able to query all the time, but only in aggregate.
These are logs that report normal or expected activity, such as web access logs showing 2xx responses. While these kinds of logs can reveal interesting trends, they aren’t necessarily interesting in isolation. In fact, your teams can subsample these logs, sending only a small portion—10 percent, for example—to hot storage. This way, your teams can draw useful conclusions from these logs but with a fraction of the throughput.
Two paths toward implementing your log management policies
Now that you’ve set up log management budgets with your teams and helped them develop rules for mitigating their log throughput, the next step is to determine how to start implementing your log management policies. In this section, we’ll cover two approaches, each with its own benefits and drawbacks:
- Excluding all logs from hot storage by default
- Including all logs in hot storage by default
The one you choose will depend on the requirements of your organization. In both approaches, we recommend routing all your logs by default to cold storage, so that you will have a safe and low-cost fallback that contains all the information you need. The two approaches differ in how your teams will route your logs to hot storage.
Exclude-by-default
In the exclude-by-default approach, you would begin by excluding all logs from hot storage. Then it would be up to your teams to identify logs to begin routing to hot storage until they hit the limit of their budget. This approach makes it more likely that your teams will remain within their log management budgets.
The drawback is that your teams are less likely to have the logs they need right away to troubleshoot incidents. As your teams respond to incidents and learn iteratively what kind of visibility they need from their logs, they can eventually arrive at a workable implementation of their log management budgets.
Include-by-default
In the include-by-default approach, your teams would send all of their logs to hot storage. Then they would stop routing logs to hot storage until they complied with the budget. This approach makes it less likely that your teams will miss a crucial message, aiding time to resolution during investigations.
However, since this approach uses the maximum level of logging resources, it probably means that your teams will go over budget unless they quickly determine how to remove logs from hot storage. One way to mitigate this problem is to onboard your teams to this approach one at a time. This means that, at most, only the team you are onboarding will be sending all of their logs to both hot and cold storage. You can work with this team to exclude logs from hot storage. Once this team is on track to meet its budget, you can start onboarding the next team.
Regardless of the approach you take, your teams should eventually align with their log management budgets. However, it’s possible that some of your teams will still struggle to align with your budget guidance.
If this is the case, you should consider revising the log management budgets you defined for those teams based on their actual usage. We recommend doing so after your teams have examined their log usage, so they have a more realistic understanding of what kind of log-based visibility they need. This will help you make better-informed decisions about the next iteration of your teams’ log management budgets. And by doing so after asking your teams to actually question their own log usage, you’re more likely to make well-informed decisions.
Streamline your log management policies with Datadog
By implementing log management policies in response to the four key questions, you can ensure that your teams can access the logs they need without going over budget. Datadog’s Logging without Limits™ helps you streamline your log management policies—and empowers your team to change these policies on the fly.
Using Datadog, you can implement your log management policies entirely within the platform. You can send logs to Datadog using the Datadog Agent, your cloud provider, or our API, and optionally add custom tags to help categorize logs and add context (e.g., the team that owns a service).
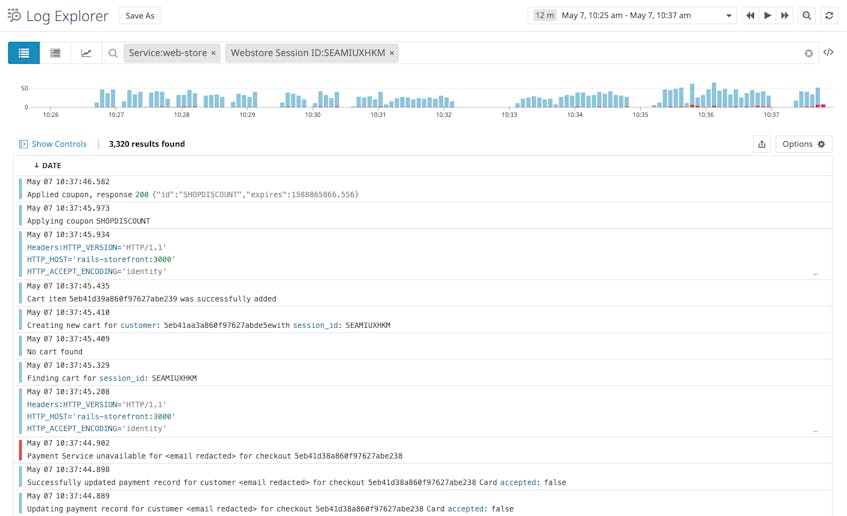
Datadog will then structure, enrich, and standardize your logs, generating a rich set of attributes for each log. This enables you to apply log management policies to logs that feature specific combinations of attributes. (For popular technologies, Datadog provides out-of-the-box log processing pipelines.) Datadog’s Live Tail view shows a feed of all ingested logs, so you can understand how your logs are being parsed. As a result, your teams can implement log management policies—and iterate between implementations—more smoothly.
Route logs dynamically
Once Datadog has ingested your logs, you can dynamically route them to hot and cold storage, enabling you to stay on budget by only using high-performance storage when necessary. You can automatically route high-value logs to hot storage by defining indexes, making that data available for faceted search, dashboarding, and alerting in Datadog.
We recommend forwarding all ingested logs to low-cost cold storage. That way, if you ever need those logs for audits, troubleshooting, or root cause analysis, you can easily use Datadog’s Log Rehydration™ to retrieve archived logs. You can send logs to cold storage—a cloud storage solution of your choice—by archiving any logs that match a certain query. We recommend setting up separate archives for production, staging, and development environments, each with its own retention period. (For instance, you could configure 13 months for production and three months for staging and development.)
You can also define exclusion filters for each index, which will automatically exclude certain types of logs from hot storage. Datadog also makes it easy for you to set retention periods for each index (e.g., three days for CI/CD logs and four weeks for error logs).
Get the samples you need
Datadog enables your teams to quickly change the logs they index, meaning that they can query the logs they need from hot storage—but only as long as they need to. Your teams can easily toggle an exclusion filter to start or stop indexing certain types of logs.
When a team begins investigating an incident that affects a particular service, for example, they can disable the filter that normally excludes that service’s DEBUG logs from the index. Once the investigation is over, they can enable that exclusion filter once again—without having to reconfigure their own infrastructure.
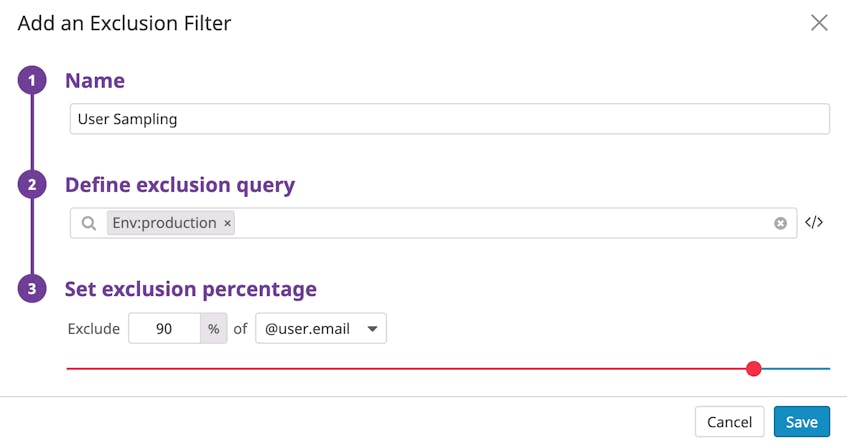
Datadog’s exclusion filters also allow you to index a percentage of incoming logs. This works well for web access logs for instance (as we mentioned earlier, where you’ll index logs for only 10 percent of user sessions for 200-status logs, and still keep 100 percent of 4xx and 5xx logs. And since Datadog can extract metrics from all of the logs it has ingested, even those that haven’t been indexed, you still keep an accurate record of your KPIs over the course of a 15-month retention period.
This provides your teams all of the visibility they need without the expense of indexing all of their logs.
Stay on budget, team by team
Datadog’s log management capabilities are especially well suited for organizations with multiple teams, each with its own needs for log-based visibility. You can define multiple indexes and assign each of them a separate set of rules for which logs will be routed to hot storage—and how long they will remain there. Your teams can use these rules to implement their log management policies based on their answers to the four questions—and continuously fine-tune these rules to ensure that they stay on budget.
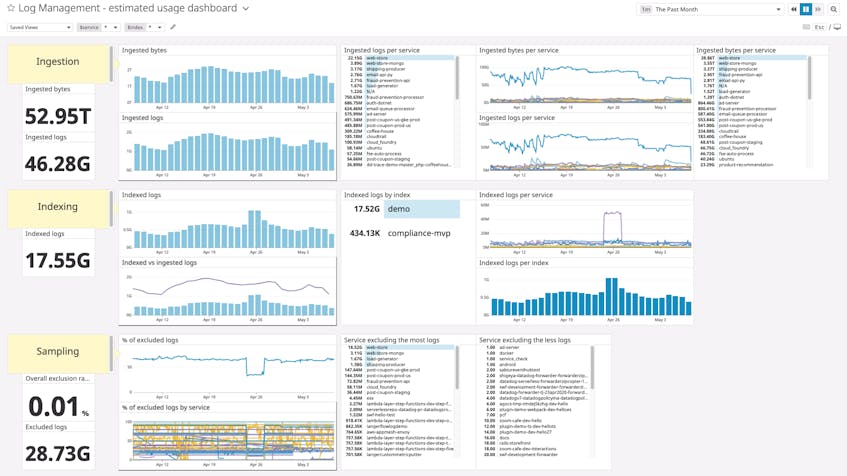
And as your teams implement their log management policies, Datadog can help them track how well they are following their budgets. Teams can graph estimated usage metrics for each log management budget—such as how many bytes of log data or log lines Datadog has ingested—with a dashboard based on our template. They can also set automated alerts when their usage is approaching a limit—or configure daily quotas for each index.
More sustainable log management policies
In this post, we’ve surveyed techniques for processing and storing logs without putting undue load on your system. You can manage these tasks entirely within Datadog, enabling you to take action quickly with minimal change to your own environment. And since you can define multiple indexes and monitor log usage by tag, Datadog is well suited for a multi-team context.
Datadog allows you to determine on the fly which logs to send to hot and cold storage, and gives you out-of-the-box visibility into your log usage. This makes it easier to implement log management policies and give your teams the right amount of information they need for any use case. If you’re interested in reducing your log management resource footprint and are not yet a Datadog customer, sign up for a free trial.
