In order to add greater depth and detail to your full-stack monitoring, Datadog is introducing a new way to explore, inspect, and monitor every process across your distributed infrastructure. That’s every PID, on every host, in one place.
We love tools like htop for real-time process monitoring, but SSH-ing into a server to run command line diagnostics quickly becomes unwieldy when your infrastructure comprises hundreds or thousands of hosts. Building on our recent release of Live Containers, our new Live Process view enables open-ended debugging and inventory management for massive, distributed systems, while preserving the features we depend on in our trusty system tools.
With Live Processes, you can query all your running processes, filter and group them using tags, and drill in to see process-level system metrics at two-second granularity.
Going deeper
We already help monitor your infrastructure and applications with our more than 750 integrations, which faithfully collect work and resource metrics from your systems. But often, after drilling down, you find that some system resource is saturated on a host. You can bounce the host and move on, but in order to prevent the issue from happening again, you need a deeper level of understanding and visibility.
By monitoring that host at the process level, you can see why the host is resource-constrained, and which piece of software is causing the issue. This visibility is especially important when a particular process goes haywire, starving other processes of resources and bringing down hosts or entire distributed services. Without complete visibility at the process level, identifying the culprit that triggered the chain reaction is nearly impossible.
Seeing the forest and the trees
The problem with monitoring every process is one of cardinality. We found that an average host runs about 100 processes, with significant variance depending on the software running. Postgres, for instance, can easily spawn thousands of workers on a single host.
Add to this the fact that familiar tools for process monitoring collect metrics frequently, and for good reason: processes move fast. By providing metrics for each PID every two seconds, Datadog’s Live Process view gives you the resolution necessary to understand spikes in CPU that could be causing problems hidden by aggregating over longer periods.
Because we provide a full accounting of every process, we also built intelligent aggregation and filtering to help you efficiently explore the hundreds of thousands or millions of processes that may be running across your cloud deployments or data centers. Using tags collected from cloud providers like AWS or provisioning systems like Chef, Puppet, or Ansible, you can pivot and slice every process tree across your deployment. Tags provide valuable context for your process metrics and enable you to navigate seamlessly between different views of your infrastructure and applications.
Exploring your processes
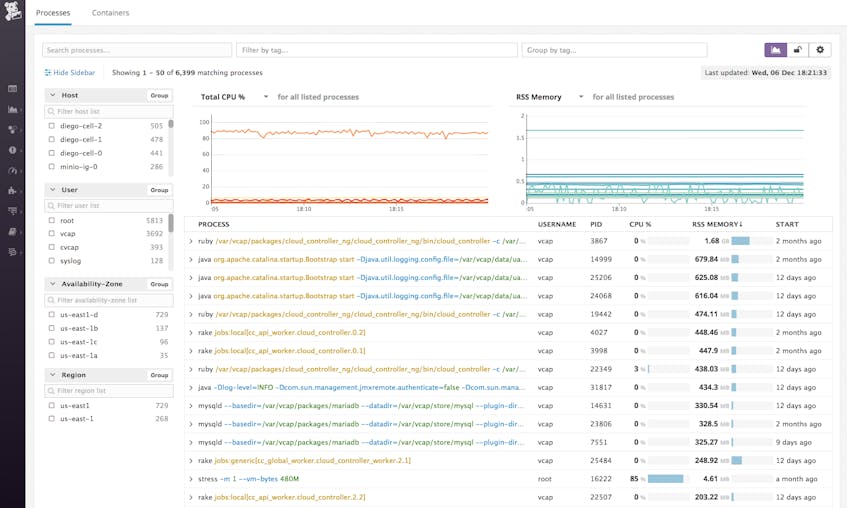
Process queries search all the metadata related to each process, including all arguments and flags. In the example above, we have filtered to Redis processes that were passed port 6383.
Next, we have pivoted the table by “role," a tag from Chef, to see whether there are resource issues that are localized to some part of the system. We can then drill into any problematic scopes immediately or filter down to reduce noise and narrow the investigation.
Visualizing process trees
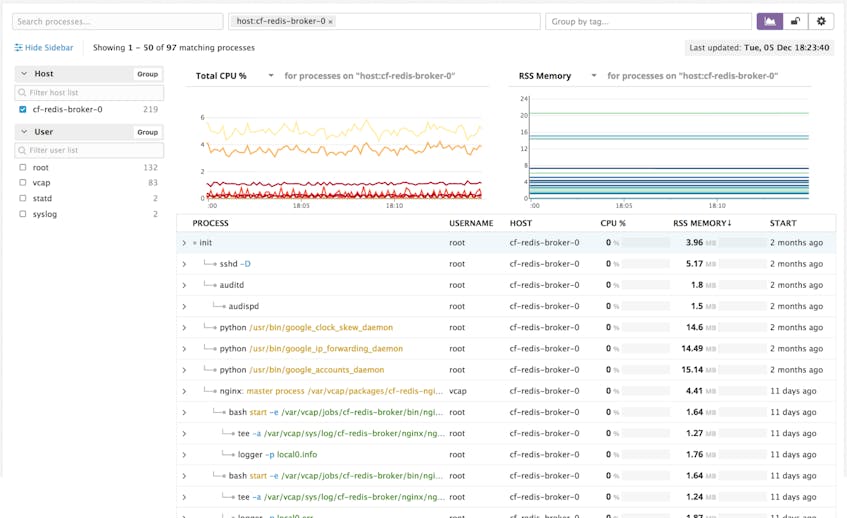
Alternatively, if you identify a host that is having issues, you can dive right in to see a more traditional htop view for that host. Here, it can be useful to visualize the process tree, which can help spot orphan processes. Summary graphs provide local context and can help you understand the effects one process has on others across the system.
Peering into containers
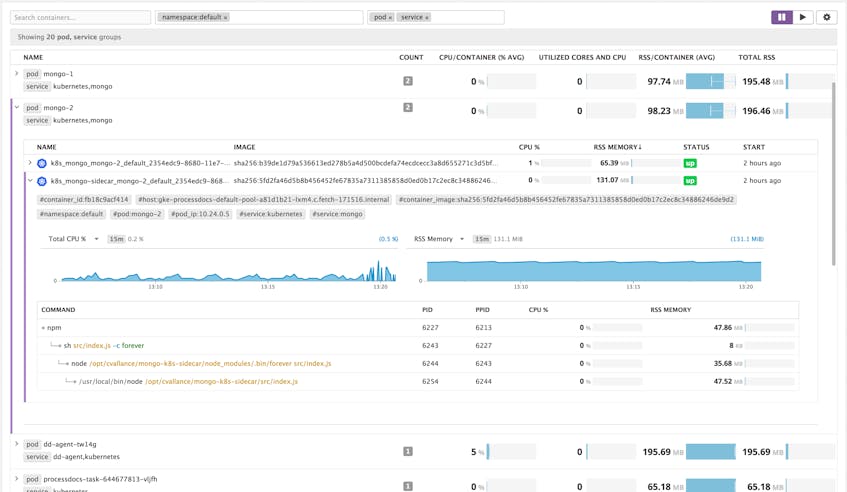
Processes are also what containers actually “contain.” With the launch of Live Processes, the complementary Live Container view has been enriched to show you the process tree within each container. Understanding what is going on under the hood of your containers can help you more effectively manage and tune your container fleet.
When a containerized process starts to act abnormally, its behavior is often hidden in the top-line stats of the container. Alternately, when container metrics do indicate a problem, it is not always clear where the issue originates. This problem is particularly acute during container migrations, where existing applications are often ported directly to containers, and a single container might still run dozens of processes. But in our experience, even containers built for a microservices architecture can spawn a deeper process tree than expected. Now you can immediately dive into process-level details to determine what is happening inside your containers.
Inventory management
Running reports against your process trees allows you to understand what software is being run, and where. This can help you manage and audit expensive licenses and understand their importance to your organization.
Additionally, many programs embed version information, either in their working directory or as arguments passed in at execution. Our fuzzy search will match any of these fields and allow you to surface, say, which versions of Postgres are being run. In some cases, running a mixed environment can lead to lost data due to version incompatibility issues. Now, based on the user field or the team tag, you can identify the engineers and teams running each version and check with them to make sure they are aware of the version mismatch.
Even when software packages do not expose version information so explicitly, sorting by “Start time” can help provide insight into the version of code being run. This is especially helpful during development, when changes are made and tested continuously.
Get started!
To get started, update your Agent to version 5.16 or higher. For standard installs, add the following line to /etc/dd-agent/datadog.conf:
process_agent_enabled: true
For Docker and Kubernetes daemonset installs, set the env variable DD_PROCESS_AGENT_ENABLED to true and mount /etc/passwd as a read-only volume into your container.
For full details, see the documentation here. And if you don’t yet have a Datadog account, you can sign up for a 14-day free trial to get complete visibility into every process, host, service, and container.


