Yair Cohen

Jonathan Epstein
In order to manage complex containerized applications, modern devops teams need to have deep visibility into the status of their Kubernetes resources. By listening directly to the Kubernetes API, the open source kube-state-metrics service generates key metrics about your Kubernetes objects, including pods, nodes, and deployments, which are essential for understanding the status and performance of your clusters. Datadog’s Kubernetes integration includes full support for kube-state-metrics, meaning you can use Datadog to get full, real-time visibility into your Kubernetes environment from a single pane of glass.
The long-awaited release of kube-state-metrics version 2.0 brings a number of updates and performance improvements upon its predecessor. Version 1.12+ of the Datadog Cluster Agent includes a new integration for kube-state-metrics v2.0 that lets you take advantage of its performance features without needing to run the kube-state-metrics service separately within your cluster.
In this post, we’ll walk through how to upgrade your Datadog Cluster Agent deployment to enable the new kube-state-metrics v2.0 integration. We’ll also look at some updates you will need to make based on changes to metrics names in the new version. This will ensure that your existing Datadog monitors and dashboards for kube-state-metrics data aren’t inadvertently deprecated.
Note that the following steps will be for updating your Datadog Cluster Agent using our Helm chart, which is our recommended method. If you’re not already using the Datadog Cluster Agent, see our documentation to get started.
Use Helm to upgrade your Datadog Cluster Agent to support kube-state-metrics v2.0
The latest version of the Datadog Agent and Datadog Cluster Agent include built-in functionality that collects kube-state-metrics v2.0 data directly from the Kubernetes API server, rather than relying on the kube-state-metrics service. This reduces the resource overhead of collecting large volumes of metrics. To upgrade your Datadog Cluster Agent to 1.12, simply update your Helm chart. If you are using kube-state-metrics v1.x, Datadog will continue to collect key cluster state data.
Enable the kube-state-metrics v2.0 check
Once you’ve upgraded your Datadog Agents using Helm, the Datadog Cluster Agent’s new Kubernetes State Metrics Core check will be enabled. To do this, simply add the following value to your values.yaml file:
...datadog:... kubeStateMetricsCore: enabled: true...Once you redeploy the chart, the Datadog Cluster Agent’s Kubernetes State Metrics Core check will be enabled.
How to successfully upgrade
There are several differences in metric names between kube-state-metrics versions 1.x and 2.0. If you do not want to use the new Kubernetes State Metrics Core check, you should not upgrade to kube-state-metrics v2.0, as the previous check does not support the updated v2.0 metric names.
Once you do enable the check, Datadog automatically updates most of your metric names to version 2.0–compatible names. However, you will still need to manually make the following updates across any Datadog graphs or monitors:
kubernetes_state.node.by_conditionreplaceskubernetes_state.nodes.by_conditionkubernetes_state.persistentvolume.by_phasereplaceskubernetes_state.persistentvolumes.by_phasekubernetes_state.pod.status_phaseis now tagged with pod-level tags (e.g.,pod_name)
For more information on changes in v2.0, see our documentation.
Monitor kube-state-metrics with Datadog
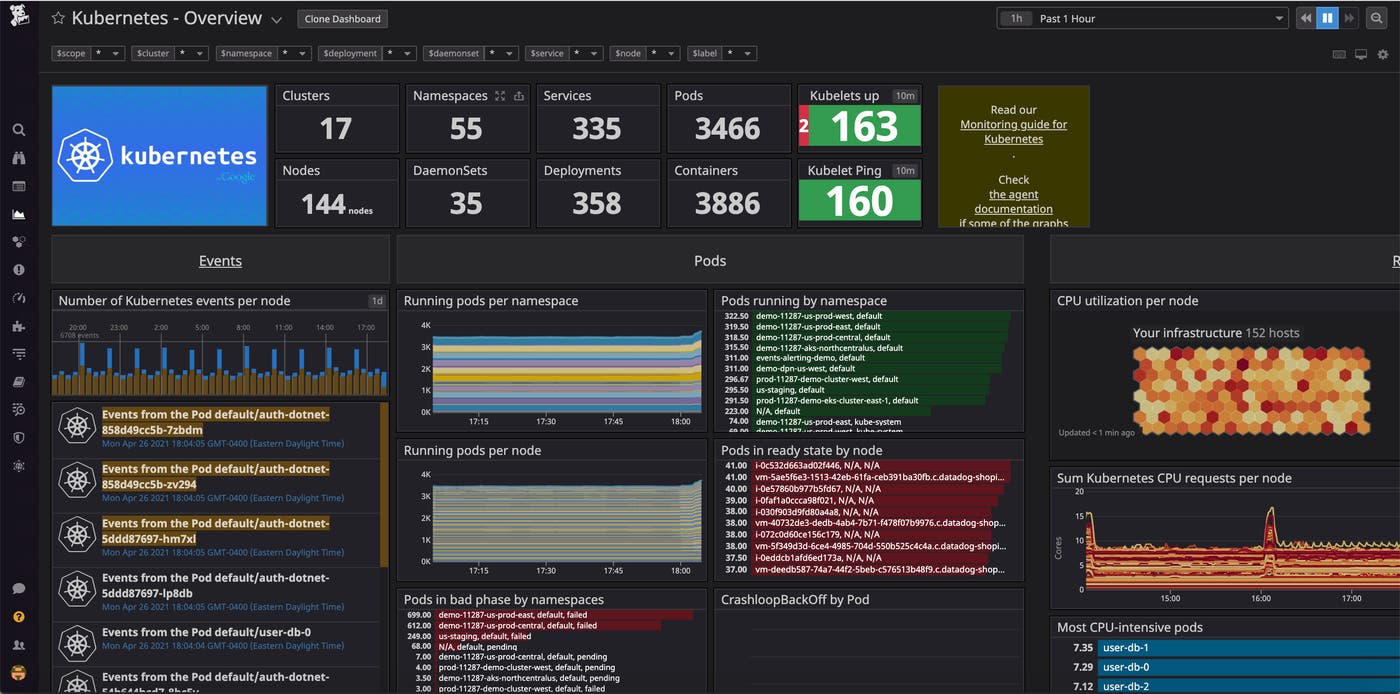
After you’ve upgraded your Agents and enabled kube-state-metrics v2.0 functionality, you can continue analyzing your kube-state-metrics data in Datadog’s out-of-the-box Kubernetes dashboard.
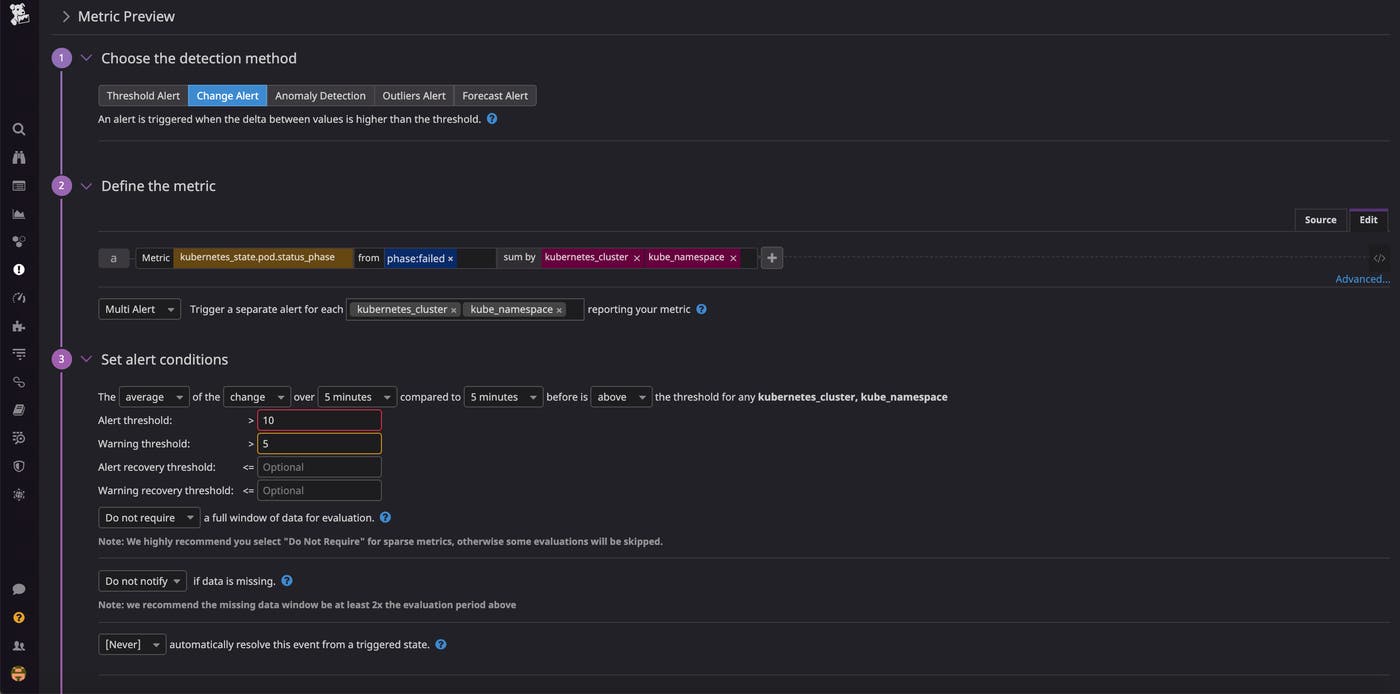
Alerting on your Kubernetes state metrics is key to staying on top of any cluster-level problems that may arise. You can easily configure your alerts to notify your teams of the issue via communication tools like Slack or PagerDuty. Monitoring kube-state-metrics lets you easily track large or unexpected changes in the availability or status of your Kubernetes objects, so alerting on things like the number of available pods can keep you abreast of problems. Or, you can track resource quota usage to make sure that new resources will spin up without any problems. In the following screenshot, we’ve set up an alert to trigger whenever more than 10 pods within a cluster have failed, thus indicating a substantial cluster issue that needs remediation.
Get started with kube-state-metrics v2.0 now
Kube-state-metrics v2.0 is now generally available, and with a few quick configuration updates, you can continue pulling the most important asset-based Kubernetes metrics into Datadog. For more information on using Datadog to monitor your Kubernetes resources, check out our documentation and monitoring guide. And if you’re not already a Datadog customer, get started today with a 14-day free trial.
