
Last year, Datadog released application performance monitoring (APM) and distributed tracing to provide full-stack visibility, all the way down to the code level. Today we’re excited to announce that Datadog APM now includes support for Java, in addition to ongoing support for Ruby, Python, and Go applications.

End-to-end Java monitoring
APM includes out-of-the-box support for automatically tracing requests to web servers such as Tomcat and Jetty, frameworks like Spring Boot and Dropwizard, and data stores like MongoDB and Cassandra, as well as database connections via JDBC. See our documentation for a full list of integrations. We’re continually adding support for more frameworks and libraries—email our support team if you’d like to make a request.
Monitor and analyze Java application performance and health with Datadog APM.
Once you deploy APM, you’ll gain access to a range of features that will help you monitor and optimize your Java applications, including:
- end-to-end visibility with distributed tracing: follow requests as they travel across multiple hosts and microservices
- detailed performance overviews: view out-of-the-box dashboards that provide latency distributions and percentiles for each monitored service, as well as a breakdown of how much each service contributes to aggregate latency
- automated, algorithmic alerts: enable suggested alerts on key service-level indicators like latency and error rates (as shown below)—or set up custom alerts powered by algorithmic features like forecasting and anomaly detection

Unifying the views
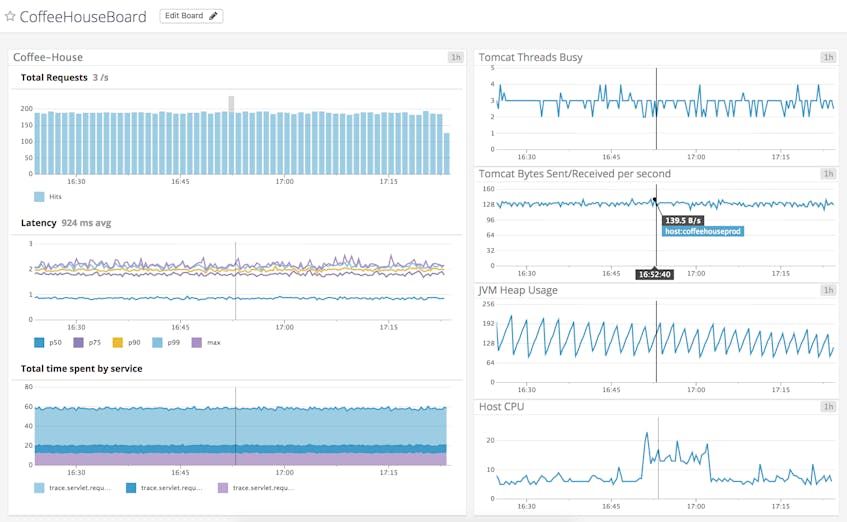
Because Datadog collects metrics from your applications and their underlying infrastructure, you can create custom dashboards that combine metrics from every layer of your stack. Below, we’ve created a custom dashboard that allows us to view infrastructure-level metrics (via Datadog’s integrations with Java and Tomcat) alongside APM metrics from our Java application.
You can also view distributed request traces alongside host-level metrics, without switching contexts. In the screenshot below, the “Host Info” tab shows the time of this request overlaid in pink on each graph. This enables you to correlate each span with key metrics (e.g., network traffic, CPU usage, etc.) from the host where the work was executed. You’ll also be able to gain additional context about that host by looking at its tags.

As Datadog continues to enhance its log processing and management capabilities, you’ll gain even more insights into your applications by seamlessly transitioning between your Java logs, distributed request traces, and metrics.
Investigate and debug errors
You can inspect each flame graph to view metadata about each span, including the full stack trace for any errors encountered along the way. You can use this additional context to help you debug and troubleshoot any issues that may be impacting application performance.

Easy setup
APM can be deployed in minutes—simply install the Datadog Agent and the Java client on your application servers. Alternatively, you can deploy Datadog APM in Docker with our docker-dd-agent image.
APM includes built-in support for OpenTracing, the vendor-neutral, open standard for distributed tracing. Because it is a vendor-neutral standard, OpenTracing enables you to easily port your applications from one distributed tracing backend to another, with minimal changes to code-level instrumentation. In the example below, we’re measuring how long it takes to create a user and save it to the database.
public class UserCreator {
  public User createUser(String fname, String lname) {
    final Scope scope = GlobalTracer.get().buildSpan("createUser").startActive(true);
    try {
      User user = newUserImpl(fname, lname);
      saveToDatabase(user);
      return user;
    } finally {
      scope.close();
    }
  }
}
See our documentation for more instrumentation examples.
Get started with APM for Java
Java support for APM is now available in Datadog. If you don’t yet have a Datadog account, sign up for a free 14-day trial to get end-to-end visibility into your Java applications.
