In Part 1, we showed you the metrics that can give you visibility into your Istio service mesh and Istio’s internal components. Observability is baked into Istio’s design—Mixer extracts attributes from traffic through the mesh, and uses these to collect the mesh-based metrics we introduced in Part 1. On top of that, each Istio component exposes metrics for its own internal workings.
Istio makes its data available for third-party software to collect and visualize, both by publishing metrics in Prometheus format and by giving you the option to enable monitoring tools like Grafana and Kiali as add-ons. In this post, we’ll show you how to use these tools to collect and visualize Istio metrics, traces, and logs:
- Configure Mixer to collect metrics from traffic in the mesh, as well as querying the Prometheus endpoints for each of Istio’s components
- Use Istio add-ons to visualize metrics from both Istio’s components and the services within your mesh
- Collect logs from Istio’s components, including Envoy proxies, to understand the internal workings of your mesh
- Gather request traces so you can visualize traffic and detect network traffic issues
- Use the Pilot debugging endpoint for visibility into the configuration that your mesh is currently using
Note that as of version 1.4, Istio has begun to move away from using Mixer for telemetry. This guide assumes you are using earlier versions, or have enabled Mixer-based telemetry collection with version 1.4.
Collecting Istio metrics
Istio generates monitoring data from two sources. The first source is an Envoy filter that extracts attributes from network traffic and processes them into metrics, logs, or other data that third-party tools can access. This is how Istio exposes its default set of mesh metrics, such as the volume and duration of requests. The second source is the code within each of Istio’s internal components. Pilot, Galley, Citadel, and Mixer are each instrumented to send metrics to their own OpenCensus exporter for Prometheus.
Configuring Envoy metrics
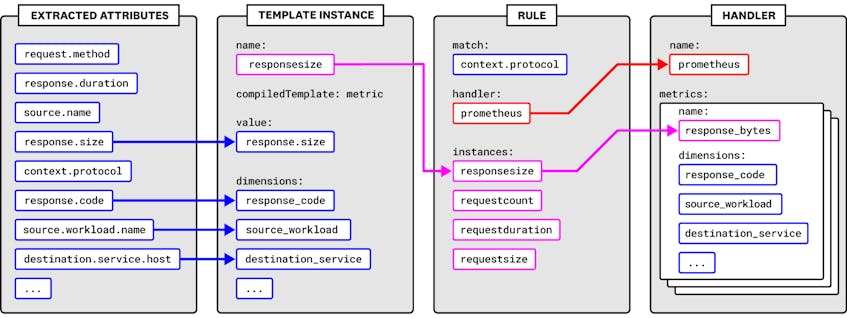
Mixer collects data from Envoy and routes it to adapters, which transform the data into a form that third-party tools can ingest. This is the source of the mesh-level metrics we introduced in Part 1: request count, request duration, and response size. You can configure this process by using a number of Kubernetes CustomResourceDefinitions (CRDs):
- Attribute: A piece of data collected from Envoy traffic and sent to Mixer
- Template: A conventional format for attribute-based data that Mixer sends to an adapter, such as a log or a metric (see Istio’s full list of templates)
- Instance: An instruction for mapping certain attributes onto the structure of a template
- Handler: An association between an adapter and the instances to send to it, for example, a list of metrics to send to the Prometheus adapter (in the case of the Prometheus handler, this also determines the metric names)
- Rule: Associates instances with a handler when their attributes match a user-specified pattern
Mixer declares a number of metrics out of the box, including the mesh-level metrics we covered in Part 1. You can find a detailed breakdown of the Mixer configuration model, and instructions for customizing your metrics configuration, in Istio’s documentation.
As an example, we’ll show you how to add the request method as a dimension of the request count metric. This will enable us to filter this metric to show only counts of GETs, POSTs, and so on.
In the default metrics configuration file, you’ll see an instance called requestcount. The compiledTemplate key assigns the instance to the metric template, which Mixer uses to dispatch attributes to handlers in the form of a metric. The value of the instance is given as 1—in other words, every time Mixer receives a request from an Envoy proxy, it increments this metric by one. Other metrics use Mixer attributes. The response duration metric uses the response.duration attribute to track how long the proxy takes to send a response after receiving a request. (See Istio’s documentation for the complete list of attributes.)
First, run the following command to output the current configuration for the requestcount CRD to a file (e.g., requestcount.yaml):
kubectl -n istio-system get instances.config.istio.io/requestcount -o yaml > /path/to/requestcount.yamlThe output should resemble the following:
requestcount.yaml
apiVersion: config.istio.io/v1alpha2
kind: instance
metadata:
  creationTimestamp: "2019-10-10T17:24:04Z"
  generation: 1
  labels:
    app: mixer
    chart: mixer
    heritage: Tiller
    release: istio
  name: requestcount
  namespace: istio-system
  resourceVersion: "1497"
  selfLink: /apis/config.istio.io/v1alpha2/namespaces/istio-system/instances/requestcount
  uid: c1d99d4c-eb82-11e9-a7de-42010a8001af
spec:
  compiledTemplate: metric
  params:
    dimensions:
      connection_security_policy: conditional((context.reporter.kind | "inbound")
        == "outbound", "unknown", conditional(connection.mtls | false, "mutual_tls",
        "none"))
      destination_app: destination.labels["app"] | "unknown"
      destination_principal: destination.principal | "unknown"
      destination_service: destination.service.host | "unknown"
      destination_service_name: destination.service.name | "unknown"
      destination_service_namespace: destination.service.namespace | "unknown"
      [...]
          monitored_resource_type: '"UNSPECIFIED"'
    value: "1"
Next, in the dimensions object, add the following key/value pair, which declares a request_method dimension with the request.method attribute as its value:
requestcount.yaml
spec:
  [...]
  params:
    [...]
    dimensions:
    [...]
      request_method: request.method
In the default metrics configuration, Mixer routes the requestcount metric to the Prometheus handler, transforming the dimensions you specified earlier into Prometheus label names. You will need to add your new label name (request_method) to the Prometheus handler for your changes to take effect. Run the following command to download the manifest for the Prometheus handler.
kubectl -n istio-system get handlers.config.istio.io/prometheus -o yaml > path/to/prometheus-handler.yamlWithin the Prometheus handler manifest, you’ll see a configuration block for the requests_total metric, which the handler draws from the template instance we edited earlier:
prometheus-handler.yaml
apiVersion: config.istio.io/v1alpha2
kind: handler
metadata:
  creationTimestamp: "2019-10-10T17:24:04Z"
  generation: 1
  labels:
    app: mixer
    chart: mixer
    heritage: Tiller
    release: istio
  name: prometheus
  namespace: istio-system
  resourceVersion: "1482"
  selfLink: /apis/config.istio.io/v1alpha2/namespaces/istio-system/handlers/prometheus
  uid: c1bf20a9-eb82-11e9-a7de-42010a8001af
spec:
  compiledAdapter: prometheus
  params:
    metrics:
    - instance_name: requestcount.instance.istio-system
      kind: COUNTER
      label_names:
      - reporter
      - source_app
      - source_principal
      - source_workload
      - source_workload_namespace
      - source_version
      - destination_app
      - destination_principal
      - destination_workload
[...]

      name: requests_total
[...]
In the label_names list, add request_method. Then apply the changes:
kubectl apply -f path/to/requestcount.yaml
kubectl apply -f path/to/prometheus-handler.yaml
You should then be able to use the request_method dimension to analyze the request count metric.
By default, Istio’s Prometheus adapter exports metrics from port 42422 of your Mixer service. This value is hardcoded into the YAML templates that Istio uses for its Helm chart.
Istio’s Prometheus endpoints
Pilot, Galley, Mixer, and Citadel are each instrumented to send metrics to their own OpenCensus exporter for Prometheus, which listens by default on port 15014 of that component’s Kubernetes service. You can query these endpoints to collect the metrics we covered in Part 1. How often you query these metrics—and how you can aggregate or visualize them—will depend on your own monitoring tools (though Istio has built-in support for a Prometheus server, as we’ll show below).
Istio ships with a Prometheus server that scrapes these endpoints every 15 seconds, with a six-hour retention period. The Prometheus add-on is enabled by default when you install Istio via Helm. You can then find the Prometheus server by running the following command.
kubectl -n istio-system get svc prometheusThe response will include the address of the Prometheus server, which you can access either by navigating to <PROMETHEUS_SERVER_ADDRESS>:9090/graph and using the expression browser or by using a visualization tool that integrates with Prometheus, such as Grafana.
Track Istio metrics with built-in UIs
Istio provides two user interfaces for monitoring Istio metrics:
- Built-in Grafana dashboards that display mesh-level metrics for each of your services
- ControlZ, a browser-based GUI that provides an overview of per-component metrics
We’ll show you how to use each of these interfaces in more detail below.
Visualize metrics with Grafana dashboards
You can visualize Istio metrics through a built-in set of Grafana dashboards. These dashboards help you identify underperforming component pods, misconfigured services, and other possible issues.
The Grafana add-on will visualize metrics collected by the Prometheus add-on. You can enable the Grafana add-on when you install Istio or upgrade an existing Istio deployment. Add the flag --set grafana.enabled=true to your Helm command, such as the following.
helm upgrade --install istio <ISTIO_INSTALLATION_PATH>/install/kubernetes/helm/istio --namespace istio-system --set grafana.enabled=trueIf Istio is already running, you can also apply Istio’s Helm chart for Grafana on its own.
Once Istio is running, you can view Istio’s built-in Grafana dashboards by entering the following command.
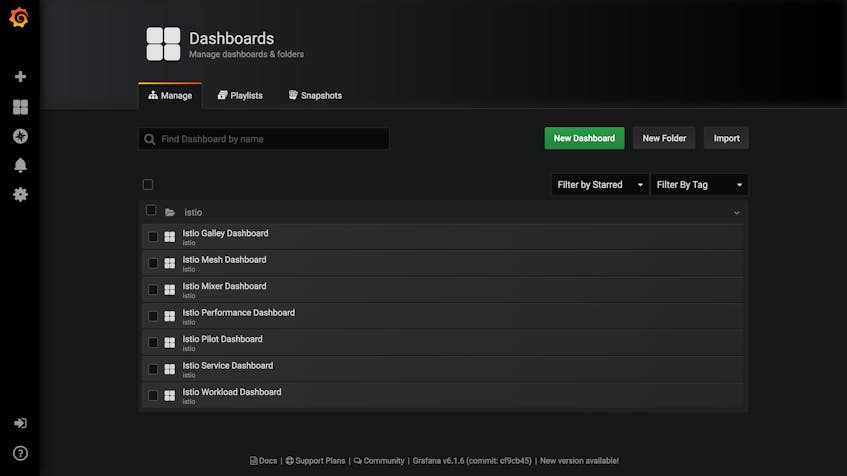
istioctl dashboard grafanaAfter Grafana opens, navigate to the “Dashboards” tab within the sidebar and click “Manage.” You’ll see a folder named “istio” that contains pre-generated dashboards.
If you click on “Istio Mesh Dashboard,” you’ll see real-time visualizations of metrics for HTTP, gRPC, and TCP traffic across your mesh. Singlestat panels combine query values with timeseries graphs, and tables show the last seen value of each metric. Some metrics are computed—the “Global Success Rate”, for example, shows the proportion of all requests that have not returned a 5xx response code.
From the Istio Mesh Dashboard, you can navigate to view dashboards showing request volume, success rate, and duration for each service and workload. For example, in the Istio Service Dashboard, you can select a specific service from the dropdown menu to see singlestat panels and timeseries graphs devoted to that service, all displaying metrics over the last five minutes. These include “Server Request Volume” and “Client Request Volume,” the volume of requests to and from the service. You can also see “Server Request Duration” and “Client Request Duration,” which track the 50th, 90th, and 99th percentile latency of requests made to and from the selected service.
Finally, the Grafana add-on includes a dashboard for each of Istio’s components. The dashboard below is for Pilot.
Note that the Grafana add-on ships as a container built on the default Grafana container image with preconfigured dashboards. If you want to edit and customize these dashboards, you’ll need to configure Grafana manually.
Use ControlZ for per-component metrics
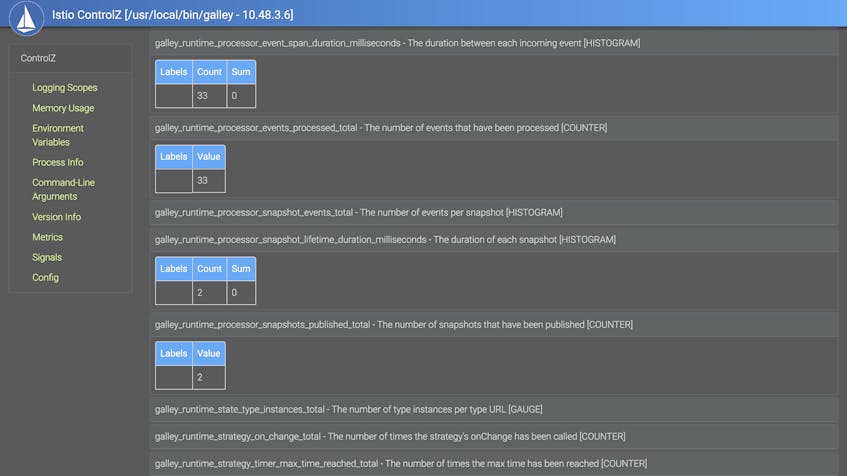
Each Istio component (Mixer, PIlot, Galley, and Citadel) deploys with ControlZ, a graphical user interface that allows you to adjust logging levels, view configuration details (e.g., environment variables), and see the current values of component-level metrics. Each component prints the following INFO log when it starts, showing you where you can access the ControlZ interface:
ControlZ available at <IP_ADDRESS>:<PORT_NUMBER>You can also open the ControlZ interface for a specific component by using the following command:
istioctl dashboard controlz <POD_NAME>.<NAMESPACE>If you’d like to open ControlZ without looking up the names of Istio pods first, you can write a bash function that opens ControlZ for the first Istio pod that matches a component name and Kubernetes namespace.
# $1: Istio namespace
# $2: Istio component
open_controlz_for (){
  podname=$(kubectl -n "$1" get pods | awk -v comp="$2" '$0~comp{ print $1; exit; }');
  istioctl dashboard controlz "$podname.$1";
}
You can then open ControlZ for Galley—which is in the istio-system namespace—by running the following command:
open_controlz_for istio-system galleyWhen you access that address, navigate to the “Metrics” sidebar topic, and you’ll see a table of the metrics exported for that component—these will include the metrics we covered in Part 1—as well as their current values. This view is useful for getting a read into the status of your components without having to execute Prometheus queries or configure a metrics collection backend. For example, we can show the current values of four Galley work metrics for events and snapshots.
Istio and Envoy logging
Istio’s components log error messages and debugging information about their inner workings, and the default deployment on Kubernetes makes it straightforward to view access logs from your Envoy proxies. Once you’ve identified a trend or issue in your Istio metrics, you can use both types of logs to get more context.
Logging Istio’s internal behavior
All of Istio’s components—Pilot, Galley, Citadel, and Mixer—report their own logs using an internal logging library, giving you a way to investigate issues you suspect to involve Istio’s functionality. You can consult error– and warning-level logs to find explicit accounts of a problem or, failing that, see which internal events took place around the time of the problem so you know which components to look into further. For example, you might see this log if Citadel is unable to get the status of a certificate you’ve created because of a connection issue:
2019-09-25T17:39:15.358855Z error istio.io/istio/security/pkg/k8s/controller/workloadsecret.go:224: Failed to watch *v1.Secret: Get https://10.51.240.1:443/api/v1/secrets?fieldSelector=type%3Distio.io%2Fkey-and-cert&resourceVersion=2028&timeout=7m34s&timeoutSeconds=454&watch=true: dial tcp 10.51.240.1:443: connect: connection refusedYou can print logs from across Istio’s internal components by using the standard kubectl logs command. Use this command to print the available logs for a specific component:
kubectl logs -n istio-system -l istio=<mixer|galley|pilot|citadel> -c <CONTAINER_NAME>For all Istio components beside Citadel, each pod includes an Envoy proxy container as well as a container for the component itself. For pods that include Envoy proxies, you’ll need to use the -c <CONTAINER_NAME> flag to specify the component’s own container, using the container name indicated in the following table.
| Component | Container |
|---|---|
| Mixer | mixer |
| Galley | galley |
| Pilot | discovery |
Istio’s components publish logs to stdout and stderr by default, but you can configure this, along with other options, when you start each Istio component on the command line. For example, you can use the --log_as_json flag to use structured logging, or assign --log_target to output paths other than stdout and stderr, such as a list of file paths.
Logging network traffic with Envoy
Sometimes you need a low-granularity view into network traffic, such as when you suspect a single pod in your Istio mesh is receiving more requests than it can handle. One way to achieve this is to track Envoy’s access logs. Since access logging is disabled by default, you’ll need to run the following command to configure Envoy to print its access logs to stdout:
helm upgrade --set global.proxy.accessLogFile="/dev/stdout" istio istio-<ISTIO_VERSION>/install/kubernetes/helm/istioYou can then tail your Envoy access logs by running the following command, supplying the name of a pod running one of your Istio-managed services (the Envoy sidecar container always has the name istio-proxy):
kubectl logs -f <SERVICE_POD_NAME> -c istio-proxyThe -f flag is not required but, if enabled, will attach your terminal to the kubectl process and print any new logs to stdout. You’ll see logs similar to the following, which follow Envoy’s default logging format and allow you to see data such as the request’s timestamp, method, and path.
[2019-09-11T20:39:25.076Z] "GET /details/0 HTTP/1.1" 200 - "-" "-" 0 178 4 3 "-" "curl/7.58.0" "428d7571-1d87-98c9-bf85-311979c228e5" "details:9080" "10.48.2.10:9080" outbound|9080||details.default.svc.cluster.local - 10.51.252.180:9080 10.48.1.14:36948 -
[2019-09-11T20:39:25.084Z] "GET /reviews/0 HTTP/1.1" 200 - "-" "-" 0 375 20 20 "-" "curl/7.58.0" "428d7571-1d87-98c9-bf85-311979c228e5" "reviews:9080" "10.48.3.4:9080" outbound|9080||reviews.default.svc.cluster.local - 10.51.251.25:9080 10.48.1.14:44112 -
[2019-09-11T20:39:25.069Z] "GET /productpage HTTP/1.1" 200 - "-" "-" 0 5179 37 37 "10.48.2.1" "curl/7.58.0" "428d7571-1d87-98c9-bf85-311979c228e5" "35.202.29.243" "127.0.0.1:9080" inbound|9080|http|productpage.default.svc.cluster.local - 10.48.1.14:9080 10.48.2.1:0 outbound_.9080_._.productpage.default.svc.cluster.local
You can configure the format of Envoy’s access logs using two options. First, you can set global.proxy.accessLogEncoding to JSON (the default, shown above, is TEXT) to enable structured logging in this format and allow a log management platform to automatically parse your logs into filterable attributes.
Second, you can change the accessLogFormat option to customize the fields that Envoy prints within its access logs. The value of the option will be a string that includes fields specified in the Envoy documentation. This example strips all the fields from the default format but the timestamp, request method, and duration. Envoy requires the final escaped newline character (\\n) in order to print each log on its own line.
helm upgrade --set global.proxy.accessLogFormat='%START_TIME% %REQ(:METHOD)% %DURATION%\\n' --set global.proxy.accessLogFile="/dev/stdout" istio istio-<ISTIO_VERSION>/install/kubernetes/helm/istio Envoy will either structure its logs directly according to your format string or, if you’ve set --accessLogEncoding to JSON, parse the format string into JSON.
As we mentioned earlier, Mixer can generate log entries by formatting request attributes into instances of the logentry template. While it’s worth noting that the logentry template exists, you can get the same information—without adding to Mixer’s resource consumption—by sending your logs directly from Envoy to an external service for analysis, as we’ll show you in Part 3. That said, using Mixer to publish request logs from your mesh ensures that all logs appear within a single location, which can be useful if you are not forwarding your logs to a centralized platform.
Tracing Istio requests
You can use Envoy’s built-in tracing capabilities to understand how much time your requests spend within different services in your mesh, and to spot bottlenecks and other possible issues. Istio supports a pluggable set of tracing backends, meaning that you can configure your installation to send traces to your tool of choice for visualization and analysis. In this section, we’ll show you how to use Zipkin, an open source tracing tool, to visualize the latency of requests within your mesh.
When receiving a request, Envoy supplies a trace ID within the x-request-id header, and applications handling the request can forward this header to downstream services. Zipkin will then use this trace ID to tie together the services that have handled a single chain of requests. A Zipkin tracer that is built into Envoy will pass additional context with incoming requests, such as an ID for each completed operation within a single trace (called a span). As long as your application sends HTTP requests with this contextual information within the headers, Zipkin can reconstruct traces from requests within your mesh.
You can enable Istio tracing by specifying a number of options when using Helm to install or upgrade Istio:
tracing.enabledinstructs Istio to launch anistio-tracingpod that runs a tracing tool. The default isfalse.tracing.providerdetermines which tracing tool to run as a container within theistio-tracingpod. The default isjaeger.global.proxy.tracerconfigures Envoy sidecars to send traces to certain endpoints, e.g., the address of a Zipkin service or Datadog Agent. The default iszipkin, but you can also chooselightstep,datadog, orstackdriver.
The example below uses the option tracing.provider=zipkin to launch a new Zipkin instance within an existing Kubernetes cluster.
helm upgrade --install istio <ISTIO_INSTALLATION_PATH>/install/kubernetes/helm/istio --namespace istio-system --set tracing.enabled=true,tracing.provider=zipkinIf you already have a Zipkin instance running in your cluster, you can direct Istio to it by using the global.tracer.zipkin.address option instead of tracing.provider.
You can then open Zipkin by running the following command.
istioctl dashboard zipkinZipkin visualizes the duration of each request as a flame graph, allowing you to compare the latencies of individual spans within the trace. You can also use Zipkin to visualize dependencies between services. In other words, Zipkin is useful for getting insights into request latency beyond the metrics you can obtain from your Envoy mesh, enabling you to see bottlenecks within your request traffic. Below, we can see a flame graph of a request within Istio’s sample application, Bookinfo.
Visualizing your service mesh with Kiali
While distributed tracing can give you visibility into individual requests between services in your mesh, sometimes you’ll want to see an overview of how your services communicate. To visualize network traffic across the services in your mesh, you can install Istio’s Kiali add-on. Kiali is a containerized service that communicates with Istio and the Kubernetes API for configuration information, and Prometheus for monitoring data. You can use this tool to identify underperforming services and optimize the architecture of your mesh.
To start using Kiali with Istio, first create a Kubernetes secret that stores a username and password for Kiali. Then install Kiali by adding the --set kiali.enabled=true option when you upgrade or install Istio with Helm (similar to the Istio monitoring tools we introduced earlier).
helm upgrade --install istio <ISTIO_INSTALLATION_PATH>/install/kubernetes/helm/istio --set kiali.enabled=trueAfter enabling the Kiali add-on, run the following command to open Kiali. You’ll need to log in with the username and password from your newly created Kubernetes secret.
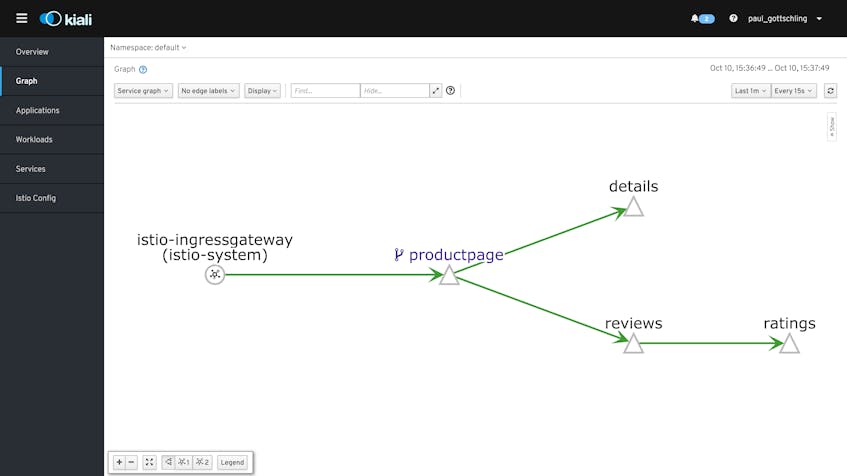
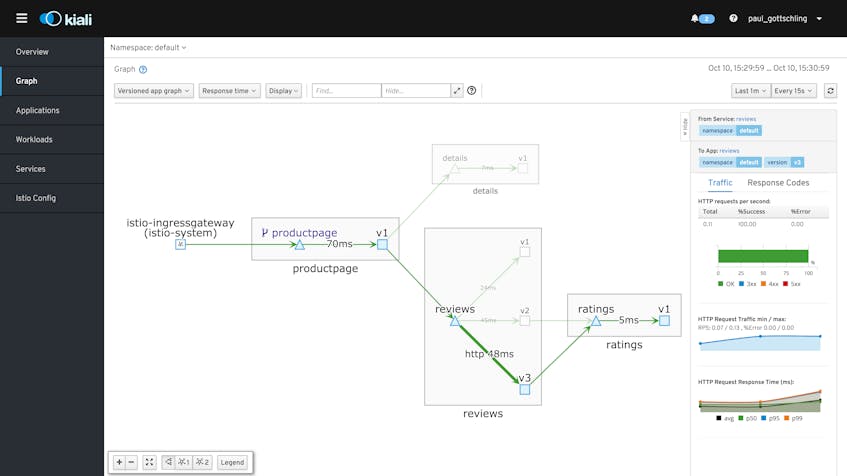
istioctl dashboard kialiKiali visualizes traffic within your mesh as a graph, and gives you a choice of nodes and edges to display. Edge labels can represent requests per second, average response time, or the percentage of requests from a given origin that a service routed to each destination. You can then choose which Istio abstractions to display as nodes by selecting a graph type:
- Service graph: services running in your mesh
- Versioned app graph: the service graph, plus nodes representing the versioned applications that receive traffic from each service endpoint
- Workload graph: similar to the versioned app graph, with applications replaced by names of Kubernetes pods
Kiali can help you detect bottlenecks, find out if a service has stopped responding to requests, and spot misconfigured service connections and other issues with traffic between your services. If you’re running a canary deployment, for example, you can view a versioned app graph and label edges with the “Requests percentage” to see how much traffic Istio is routing to each version of the deployment, then switch to “Response time” to compare performance between the main deployment and the canary.
In the versioned app graph below (from Istio’s Bookinfo sample application), we are canarying two versions of a service, and can see how adding a downstream dependency for versions 2.0 and 3.0 has impacted performance: requests to versions 2.0 and 3.0 have nearly double the response times of requests to version 1.0.
Go deep into your traffic configurations with the Pilot debugging endpoints
Pilot exposes an HTTP API for debugging configuration issues. If your mesh is routing traffic in a way you don’t expect, you can send GET requests to a debugging endpoint to return the information Pilot maintains about your Istio configuration. This information complements the xDS metrics we introduced in Part 1 by showing you which proxies Pilot has connected to, which configurations Pilot is pushing via xDS, and which user-created options Pilot has processed.
To fetch data from one of the debugging endpoints, send an HTTP GET request to the Pilot service’s monitoring or HTTP ports (by default, 15014 and 8080, respectively). Unless you have changed the configuration of your Pilot service, its DNS address should be istio-pilot.istio-system, and it will be available only from within your Kubernetes cluster. You can access the debugging endpoints by running curl from a pod within your cluster:
kubectl -n istio-system exec <POD_NAME> curl istio-pilot.istio-system:8080/debug/<DEBUGGING_ENDPOINT>The debugging endpoints allow you to inspect two kinds of configuration in order to troubleshoot issues with traffic management. The first is the configuration that users submit to Pilot (via Galley), and that Pilot processes into its service registry and configuration store. The second is the set of configurations that Pilot pushes to Envoy through the xDS APIs (see Part 1).
Debugging Pilot user configuration
You can use one set of debugging endpoints to understand how Pilot “sees” your mesh, including the user configurations, services, and service endpoints that Pilot stores in memory.
/debug/configz: The configurations that Pilot has stored. These contain the same information as the Kubernetes CRDs you use to configure mesh traffic routing, but reflect the currently active Pilot configuration. This is not only useful for understanding which configuration your mesh is using, it can also help you troubleshoot a high value of the pilot_proxy_convergence_time metric, which depends on the size of the configuration Pilot is pushing./debug/registryz: Information about each service that Pilot names in its service registry./debug/endpointz: Information about the service instances—i.e., versions of a service bound to their own endpoints—that Pilot currently recognizes for each service in the service registry.
Debugging data pushed via xDS
Pilot processes its store of user configurations, services, and service endpoints into data that it can send to proxies via the xDS APIs. Each API is responsible for controlling one aspect of Envoy’s configuration. Pilot’s built-in xDS server implements four APIs:
| API name | What it configures |
|---|---|
| Cluster Discovery Service (CDS) | Logically connected groups of hosts (called clusters) |
| Endpoint Discovery Service (EDS) | Metadata about an upstream host |
| Listener Discovery Service (LDS) | Envoy listeners, which process network traffic within a proxy |
| Route Discovery Service (RDS) | Configurations for HTTP routing |
Istio also implements Envoy’s Aggregated Discovery Service (ADS), which sends and receives messages for the four APIs.
You can use three of the debugging endpoints to see how Pilot has processed your user configurations into instructions for Envoy. Because these endpoints return the same data types that Pilot uses for xDS-based communication (in JSON format), they can help you work out why your mesh has routed traffic in a certain way. You can read the documentation for each data type to see which information you can expect from the debugging API.
| Endpoint | Service(s) | Response data type(s) |
|---|---|---|
/debug/edsz | EDS | ClusterLoadAssignment |
/debug/cdsz | CDS | Cluster |
/debug/adsz | ADS, CDS, LDS, RDS | Listener, RouteConfiguration, Cluster |
For example, if you applied a weight-based routing rule that doesn’t seem to be taking effect as you intended, you could query the /debug/configz endpoint to see if Pilot has loaded the new rule.
You can also inspect the ClusterLoadAssignment objects you receive from the /debug/edsz endpoint to see how Pilot has translated your configurations into weighted endpoints. Envoy can route requests using a weighted round robin based on an LDS message, and the response from the endpoint indicates the weighting of each Envoy cluster as well as the hosts the cluster contains.
The response from /debug/edsz shows the hosts in a cluster each carrying a weighting of 1 (the lowest possible weighting), with the cluster as a whole carrying a weighting of 3. If you had wanted this cluster to have a higher or lower weighting relative to others in your mesh, you could check the configuration you wrote for Pilot or look for issues with Pilot’s xDS connections.
  "clusterName": "outbound_.15020_._.istio-ingressgateway.istio-system.svc.cluster.local",
  "endpoints": [
    {
      "locality": {
        "region": "us-central1",
        "zone": "us-central1-b"
      },
      "lbEndpoints": [
        {
          "endpoint": {...},
          "metadata": {...},
          "loadBalancingWeight": 1
        },
        {
          "endpoint": {...},
          "metadata": {...},
          "loadBalancingWeight": 1
        },
        {
          "endpoint": {...},
          "metadata": {...},
          "loadBalancingWeight": 1
        }
      ],
      "loadBalancingWeight": 3
    }
  ]
}
It’s worth noting that the /debug/cdsz endpoint returns a subset of the data you would get from /debug/adsz—both APIs call the same function behind the scenes to fetch a list of Clusters, though the /debug/adsz endpoint also returns other data.
Sifting through your mesh
In this post, we’ve learned how to use Istio’s built-in support for monitoring tools, as well as third-party add-ons like Kiali, to get insights into the health and performance of your service mesh. In Part 3, we’ll show you how to set up Datadog to monitor Istio metrics, traces, and logs in a single platform.
Acknowledgments
We’d like to thank Zack Butcher at Tetrate as well as Dan Ciruli and Mandar Jog at Google—core Istio contributors and organizers—for their technical reviews of this series.


