


Jordan Obey
Akamai mPulse is a real user monitoring (RUM) service that enables organizations to get deep visibility into end user experience across their websites or applications. With mPulse, businesses can collect high-granularity metrics directly from their users’ browsers, and then analyze that data to pinpoint slow resources (e.g., third-party scripts), track user engagement, and make decisions to improve the performance of their products. With Datadog’s Akamai mPulse integration, you can get comprehensive visibility across your web stack by analyzing and correlating RUM metrics alongside performance data from your CDN and backend infrastructure.
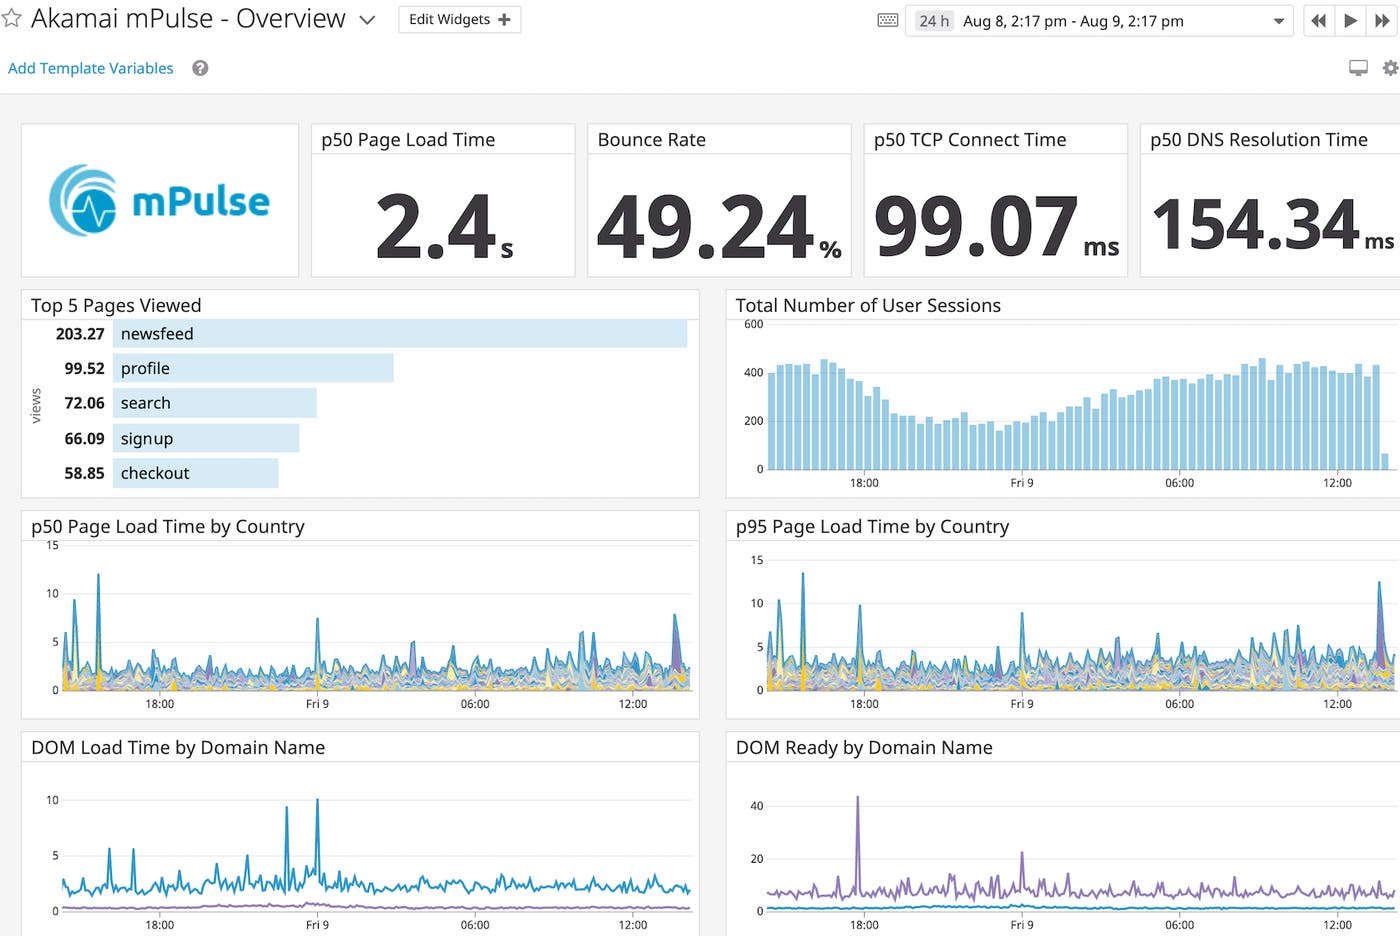
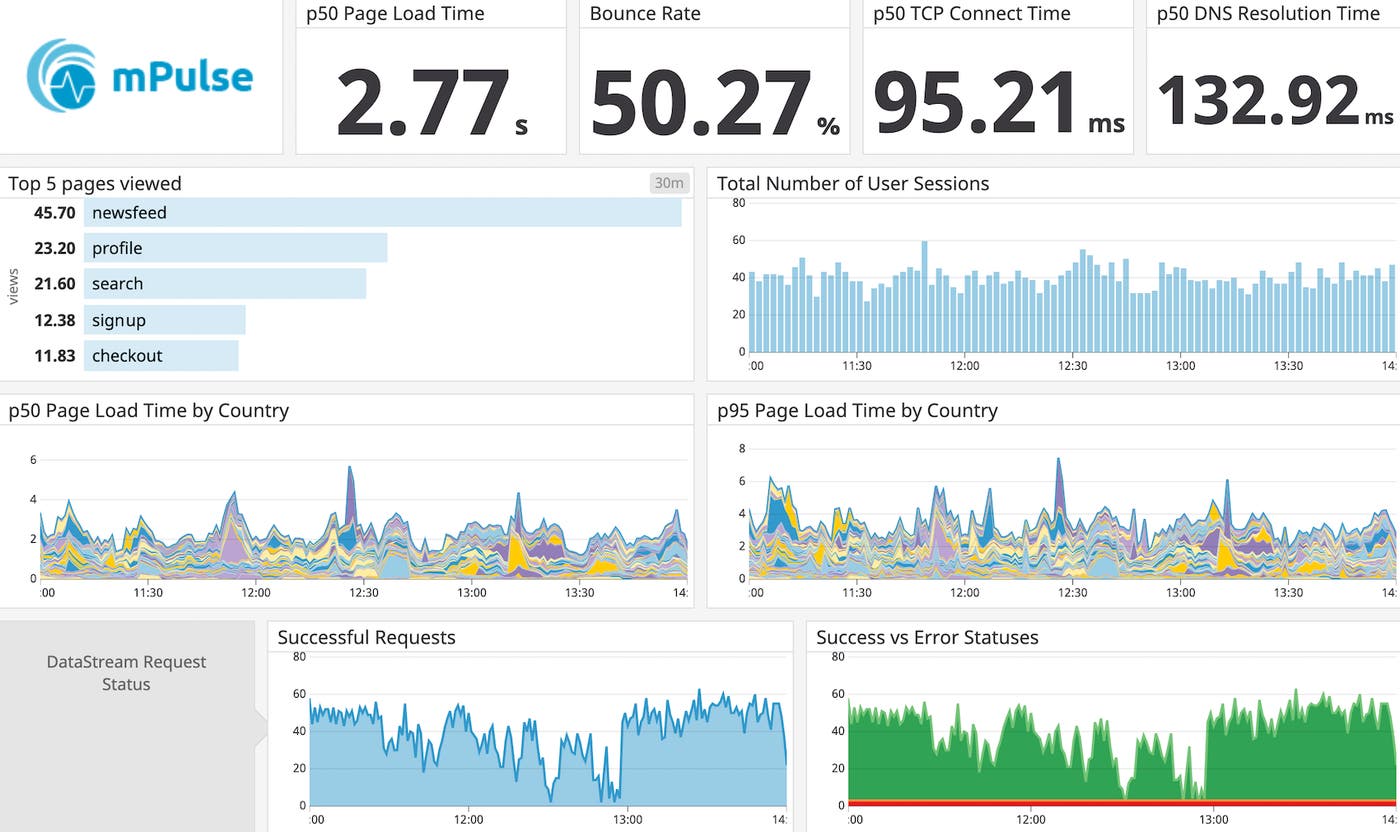
Once you set up the integration, mPulse data will flow into an out-of-the-box dashboard in Datadog, so you can get an overview of key metrics like bounce rate, user sessions, and page load times. By correlating mPulse RUM metrics with performance data from databases, web servers, and other server-side components, you can investigate the source of any user-facing slowdown, whether it originates in the frontend or backend.
Track page load time
When users visit a website or log into an application, they expect pages to load quickly. According to research from Akamai, if an e-commerce page takes longer than two seconds to load, it increases the likelihood that customers will navigate to another service. Slow page load times can also contribute to an increase in bounce rates if users decide to abandon a homepage because it is taking too long to load.
The mPulse integration includes a wide range of metrics to help you understand the latency of your website or application from your users’ perspective, including the 50th- and 95th-percentile page load times (akamai.mpulse.pageload.p50 and akamai.mpulse.pageload.p95). You can also monitor the duration of various stages of the page load process, including how long it takes for a client to receive the first byte of a response (mpulse.firstbyte), the time between the first and last bytes of a response (mpulse.firstlastbyte), and the time it takes for a browser to render (mpulse.firstpaint). See the full list of metrics included in this integration here.
To avoid an increase in bounce rate, you can set up an alert to notify you if the 95th-percentile page load time is higher than two seconds over a specific time interval (the past minute, hour, etc.), enabling you to start troubleshooting quickly.
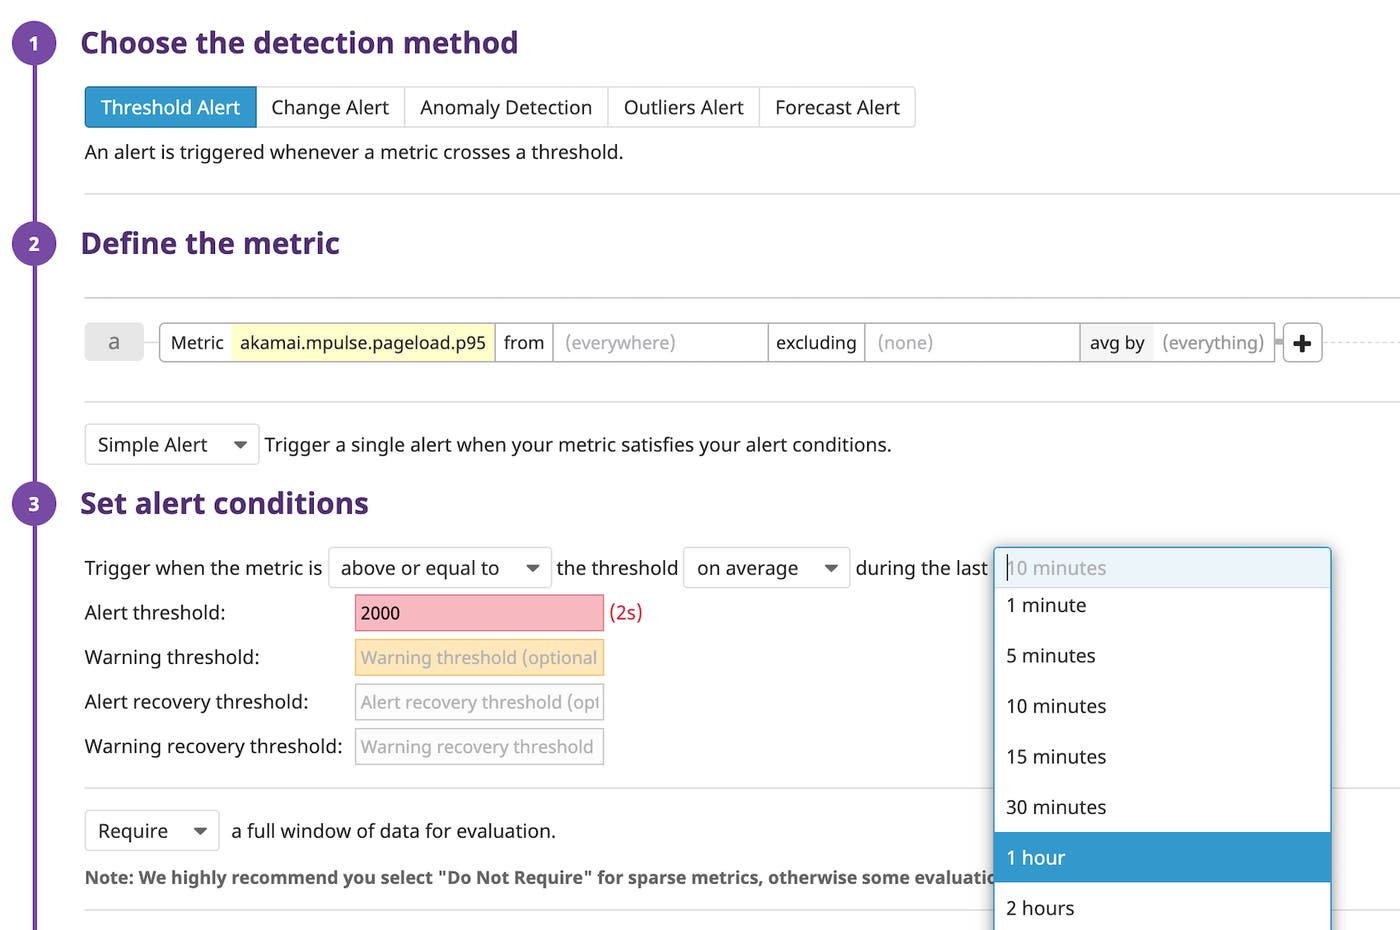
If this alert triggers, you can take steps to investigate and resolve the issue. For instance, Datadog automatically tags incoming metrics by country, so you can see which regions are affected. If you’re using Akamai DataStream, you can also correlate mPulse page load time metrics with your CDN metrics to help identify the source of the bottleneck.
Monitor page group traffic
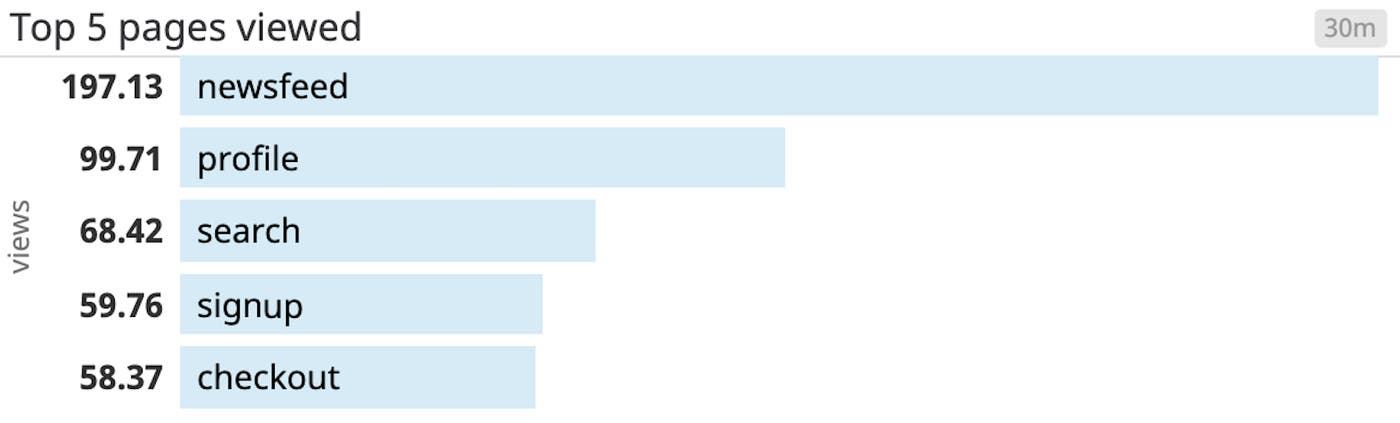
If you set up page groups to categorize similar pages (e.g., all of the pages relevant to logging in or signing up for an account), your page view metrics will automatically get tagged by page_group in Datadog. This means, for example, that you can see which parts of your service are used the most by creating a top list that ranks page groups by the number of views. This way, you can prioritize heavily trafficked and business-critical parts of your site to ensure they are optimized for high performance before shifting your focus to other sections.
You can also use this information to investigate and determine why certain parts of your site are not receiving much traffic. These factors might include slow page load times, out-of-date content, or UI design that hinders site navigation. You may also consider correlating slow page load times with 404 and 5xx errors recorded from DataStream and/or your backend web server to help you troubleshoot.
Keep a finger on the pulse of your web stack
If you rely on Akamai mPulse to optimize your end user experience, Datadog’s new integration can provide enhanced visibility into the performance data that matters most to your business. After you set up the integration, you can immediately start correlating those metrics with real-time data from Akamai DataStream, NGINX, MySQL, and more than 1,000 other technologies for a frontend-to-backend view of your web stack.
If you aren’t already using Datadog to monitor the performance of your site, get started with a 14-day free trial .


