

This post is Part 4 of a 4-part series about monitoring OpenStack Nova. Part 1 explores the key metrics available in Nova, Part 2 is about collecting operational data from Nova, and Part 3 details how to monitor Nova with Datadog
Lithium was founded in 2001 as an offshoot from gamers.com (a gaming community) and has since evolved into a leading social software provider whose Total Community platform helps brands connect, engage and understand their customers. With more than 400 communities and growing, Lithium uses OpenStack as a private datacenter, with flexibility to deploy customized, public-facing communities to major brands across industries and regions.
In this article we will pull back the curtain to learn Lithium’s best practices and tips for using OpenStack, and how Lithium monitors OpenStack with the help of Datadog.
Why monitoring OpenStack is critical
OpenStack is a central component in Lithium’s infrastructure, forming the backbone of their service platform. Lithium leverages OpenStack for both production and development environments, with OpenStack hosting a large number of production communities, as well as demo communities for sales engineers.
In addition to community hosting, OpenStack also hosts infrastructure services, including Kubernetes, Chef servers and BIND slaves.
With such a far-reaching deployment, failure is not an option. If OpenStack were not properly monitored and managed, numerous and noticeable failures can occur: sales engineers wouldn’t be able to create demo environments for prospects, developers wouldn’t be able to spawn test environments, and the communities in production could go down or see increased response times as computing resources became unavailable.
That’s why Lithium’s engineers monitor OpenStack around the clock. Using Datadog, they can correlate all the relevant OpenStack metrics with metrics from other parts of their infrastructure, all in one place. Lithium engineers can spot issues at a glance and determine the root cause of the problem, in addition to setting up advanced alerts on mission-critical metrics.
Key metrics for Lithium
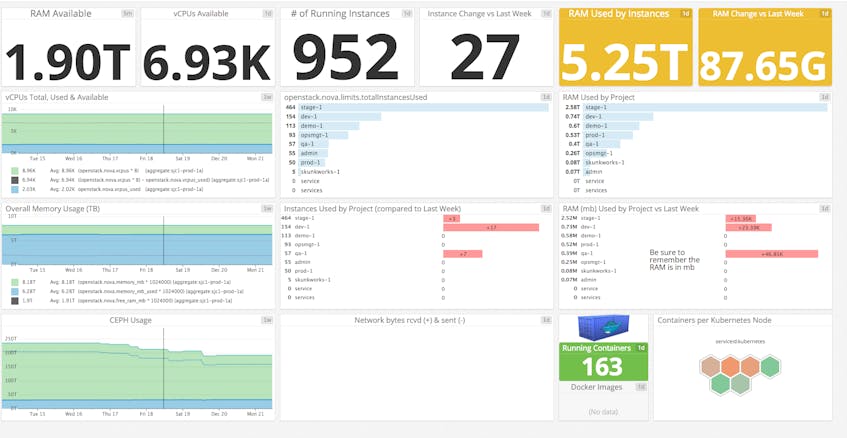
Number of instances running
Lithium engineers track the total number of instances running across their OpenStack deployment to correlate with changes in other metrics. For example, a large increase in total RAM used makes sense in light of additional instances being spun up. Tracking the number of instances running alongside other metrics helps inform decisions for capacity and tenant quota planning.
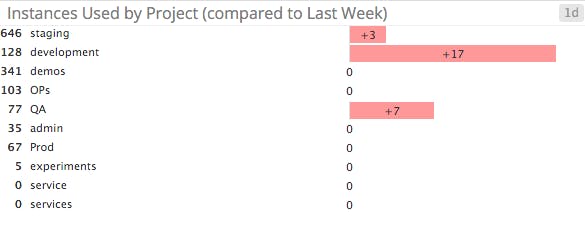
Instances per project
Like the total number of instances running, Lithium tracks the number of instances used per project to get a better idea of how their private cloud is being used. A common problem they found was that engineers would often spin up development environments and forget to shut them down, which means resources were provisioned but unused. By tracking the number of instances per project, admins could rein in excessive or unnecessary usage and free up resources without resorting to installing additional hardware.
Available memory
As mentioned in Part 1 of our series on monitoring OpenStack Nova, visibility into OpenStack’s resource consumption is essential to ensuring smooth operation and preventing user frustration. If available resources were insufficient, sales engineers would be breathing down the neck of the techops team, unable to create demo accounts for prospects, and developers would be stuck without a dev environment.
VCPU available
Just like available memory, tracking the number of VCPUs available for allocation is critical—a lack of available CPUs prevents provisioning of additional instances.
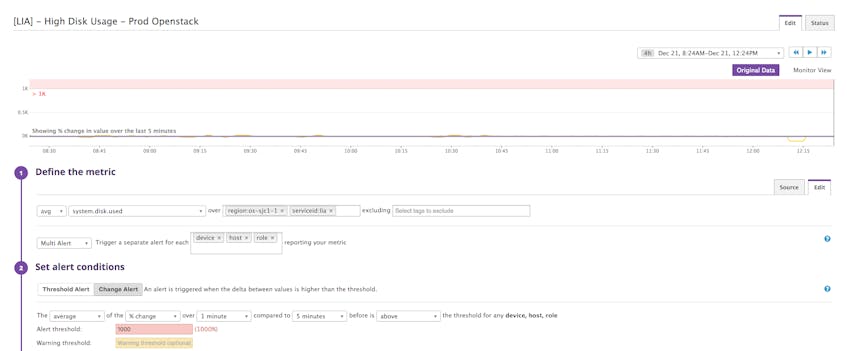
Metric deltas
Finally, Lithium tracks the changes in metrics’ values over time to give insight into the causes of changes in resource availability and consumption.
Using Datadog’s Change graph feature, engineers have a bird’s eye view of week-to-week changes in resource usage. By analyzing resource deltas, engineers and decision makers have the data they need to inform hardware purchasing decisions and perform diligent capacity planning.
Alerting the right people
Alerting is an essential component of any monitoring strategy—alerts let engineers react to issues as they occur, before users are affected. With Datadog alerts, Lithium is able to send notifications via their usual communication channels (chat, PagerDuty, email, etc.), as well as provide engineers with suggested fixes or troubleshooting techniques—all without human intervention.
Lithium generally uses PagerDuty for priority alerts, and HipChat or email for lower-priority alerts and for alerting specific engineers to a particular issue. For OpenStack, Lithium alerts on excessive resource consumption. As mentioned in Part 1 of our OpenStack series, monitoring resource consumption is a critical part of a comprehensive OpenStack monitoring strategy.
Datadog alerts give Lithium engineers the flexibility to inform the right people that a problem has occurred, at the right time, across an ever-growing list of platforms.
Why Datadog?
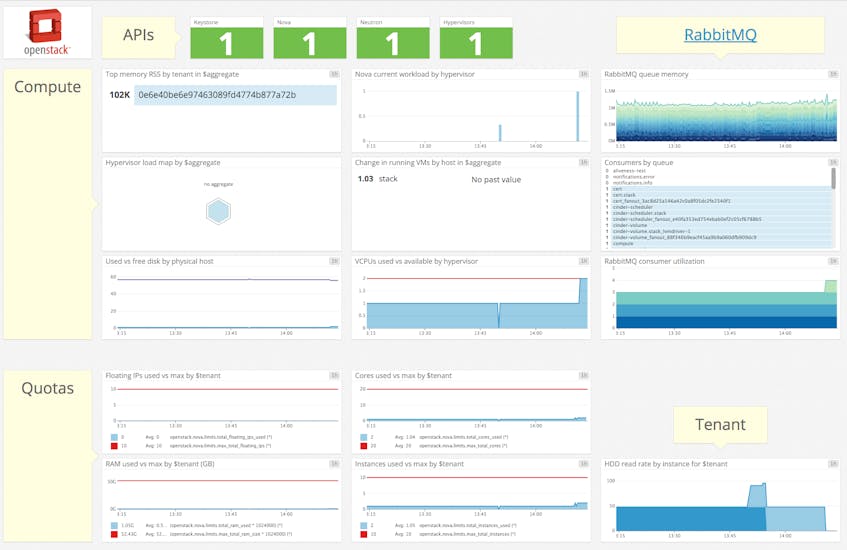
Before adopting Datadog, Lithium admins were relying on Horizon (OpenStack’s canonical dashboard) to extract meaningful metrics from their deployment. This approach was severely limited—engineers could only access rudimentary statistics about their deployment and lacked the ability to correlate metrics from OpenStack with metrics from across their infrastructure.
With Datadog screenboards, they can combine the historical perspective of graphed timeseries data with alert values to put current operations metrics in context.

Datadog also makes it easy to collect and monitor RabbitMQ and MySQL metrics, in addition to general OpenStack metrics, for even deeper insight into performance issues. For Lithium, having Datadog in place has allowed engineers to adjust internal workflows, reducing the total number of elements that need monitoring.
Saving time, money, and reputation
Adopting Datadog has allowed Lithium to catch problems in OpenStack as well as applications running on their OpenStack cloud. Now, Lithium engineers have the tools and information they need to react quickly to problems and resolve infrastructure issues with minimal customer impact, saving time, money, and reputation.
Conclusion
If you’re already using OpenStack and Datadog, we hope these strategies will help you gain improved visibility into what’s happening in your deployment. If you don’t yet have a Datadog account, you can start monitoring OpenStack performance today with a free trial.
Acknowledgments
Thanks to Lithium and especially Mike Tougeron, Lead Cloud Platform Engineer, for generously sharing their OpenStack expertise and monitoring strategies for this article.
