

This post is part 3 of a 3-part series on monitoring Amazon ElastiCache. Part 1 explores the key ElastiCache performance metrics, and Part 2 explains how to collect those metrics.
Coursera launched its online course platform in 2013, and quickly became a leader in online education. With more than 1,000 courses and millions of students, Coursera uses ElastiCache to cache course metadata, as well as membership data for courses and users, helping to ensure a smooth user experience for their growing audience. In this article we take you behind the scenes with Coursera’s engineering team to learn their best practices and tips for using ElastiCache, keeping it performant, and monitoring it with Datadog.
Why monitoring ElastiCache is crucial
ElastiCache is a critical piece of Coursera’s cloud infrastructure. Coursera uses ElastiCache as a read-through cache on top of Cassandra. They decided to use Memcached as the backing cache engine because they only needed a simple key-value cache, because they found it easier than Redis to manage with its simpler model, and because it is multi-threaded.
Among other uses, they cache most of the elements on a course page, such as title, introduction video, course description, and other information about the course.
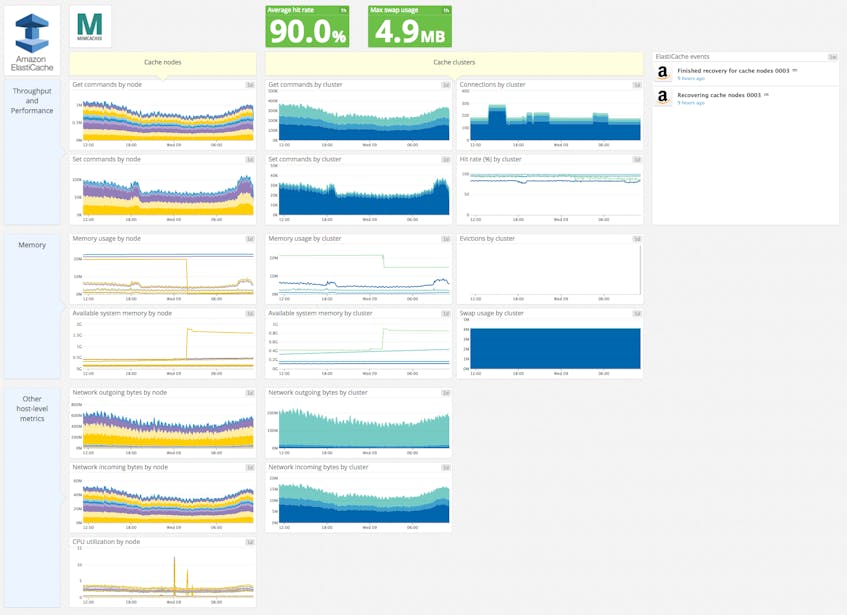
If ElastiCache is not properly monitored, the cache could run out of memory, leading to evicted items. This in turn could impact the hit rate, which would increase the latency of the application. That’s why Coursera’s engineers continuously monitor ElastiCache. They use Datadog so they can correlate all the relevant ElastiCache performance metrics with metrics from other parts of their infrastructure, all in one place. They can spot at a glance if their cache is the root cause of any application performance issue, and set up advanced alerts on crucial metrics.
Key metrics for Coursera
CPU Utilization
Since, unlike Redis, Memcached’s CPU can go up to 90 percent without impacting the performance, it is not a metric that Coursera alerts on. Nonetheless, they track it to facilitate investigation of problems.
Memory
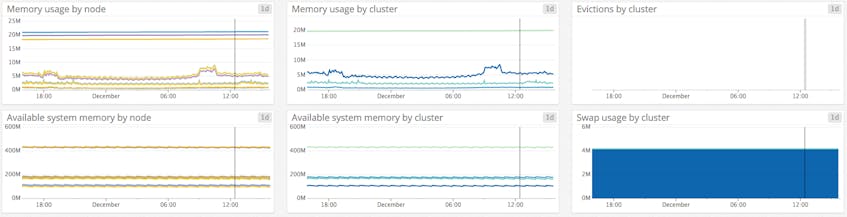
Memory metrics, on the other hand, are critical and are closely monitored. By making sure the memory allocated to the cache is always higher than the memory usage, Coursera’s engineering team avoids evictions. Indeed they want to keep a very high hit rate in order to ensure optimal performance, but also to protect their databases. Coursera’s traffic is so high that their backend wouldn’t be able to address the massive amount of requests it would get if the cache hit rate were to decrease significantly.
They tolerate some swap usage for one of their cache clusters but it remains far below the 50-megabyte limit AWS recommends when using Memcached (see part 1).
Get and Set
Coursera uses a consistent hashing mechanism, which means that keys are distributed evenly across the nodes of a cluster. Thus monitoring Get and Set commands, broken down by node, allows them to check if nodes are all healthy, and if the traffic is well balanced among nodes. If a node has significantly more gets than its peers, this may indicate that it is hosting one or more hot keys (items requested with extreme frequency as compared to the others). A very hot key can max out the capacity of a node, and adding more nodes may not help, since the hot key will still be hosted on a single node. Nodes with higher throughput performance may be required.
Network
Coursera also tracks network throughput because ElastiCache is so fast that it can easily saturate the network. A bottleneck would prevent more bytes from being sent despite available CPU and memory. That’s why Coursera needs to visualize these network metrics broken down by host and by cluster separately to be able to quickly investigate and act before saturation occurs.
Events
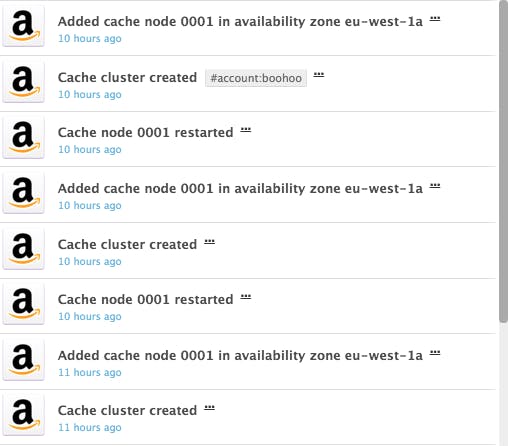
Lastly, seeing ElastiCache events along with cache performance metrics allows them to keep track of cache activities—such as cluster created, node added, or node restarted—and their impact on performance.
Alerting via the right channel
Critical alerts
Some metrics are critical, and Coursera’s engineers want to make sure they never exceed a certain threshold. Datadog alerts allow them to send notifications via their usual communication channels (PagerDuty, chat apps, emails…) so they can target specific teams or people, and quickly act before a metric goes out of bounds.
Coursera’s engineers have set up alerts on eviction rate, available memory, hit rate, and swap usage.
Datadog alerts can also be configured to trigger on host health, whether services or processes are up or down, events, outliers, and more.
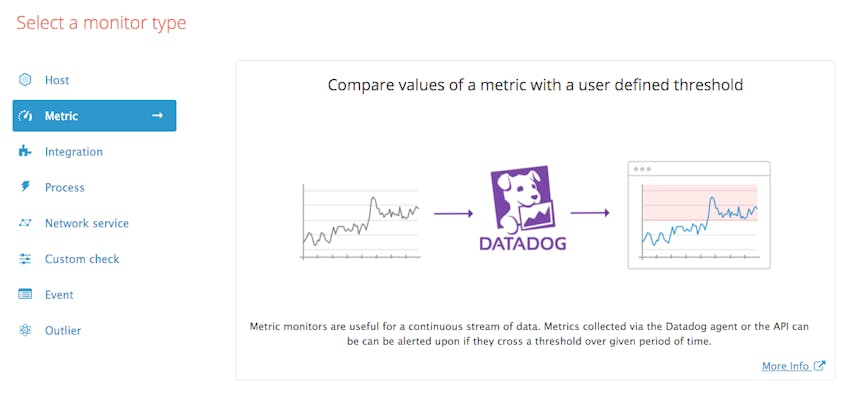
For example, as explained in part 1 of this series, where we detail the key ElastiCache metrics and which ones to alert on, CPU usage shouldn’t exceed 90 percent with Memcached. Here is how an alert can be triggered any time any individual node sees its CPU utilization approaching this threshold:
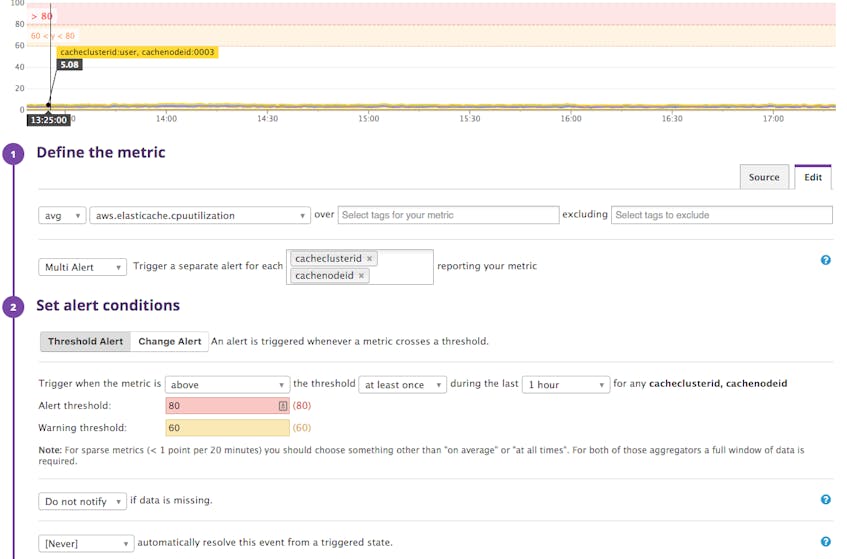
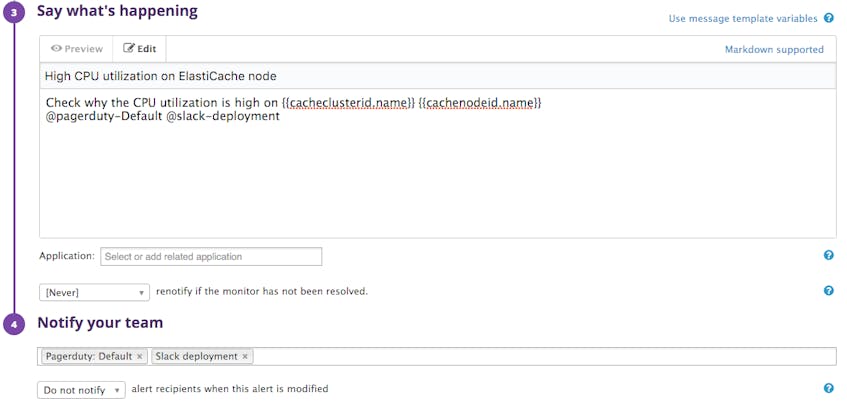
The right communication channel
Coursera uses PagerDuty for critical issues, and Slack or email for low-priority problems. When configuring an alert, you can define a custom message (including suggested fixes or links to internal documentation), the people or team that will be notified, and the specific channel by which the alert will be sent. For example, you can send the notification to the people on-call via PagerDuty and to a specific Slack channel:
Why Datadog?
Using Datadog allows Coursera to track all the metrics they need from the different parts of their infrastructure, in one place, with any relevant type of visualization. Thus they can spot at a glance any potential issue related to their cache and quickly find the root cause.
By creating dashboards they can overlay events from a specific service like ElastiCache and correlate them with performance metrics from other parts of their infrastructure.
Datadog also makes it easy to collect and monitor native cache metrics from Redis or Memcached, in addition to generic ElastiCache metrics from Amazon, for even deeper insight into cache performance.
If you’re using ElastiCache and Datadog already, we hope that these tips help you gain improved visibility into what’s happening in your cache. If you don’t yet have a Datadog account, you can start tracking your cache’s health and performance today with a free trial.
Acknowledgments
We want to thank the Coursera team, and especially Daniel Chia, who worked with us to share their monitoring techniques for Amazon ElastiCache.
Source Markdown for this post is available on GitHub. Questions, corrections, additions, etc.? Please let us know.
