

Datadog already combines infrastructure metrics with application performance monitoring (APM) for full visibility into your systems and applications from a single platform. Now, the new Host Info feature in Datadog APM makes it even easier to get immediate infrastructure-level context for your service requests by displaying host system metrics and tags side-by-side with your traces.
Bringing APM and metrics closer together
Datadog’s new Host Info panel lets you see host system metrics and request traces on a single pane of glass for more context and easy correlation. With Datadog APM, you can trace requests from end to end as they traverse your infrastructure. Flame graph visualizations break each trace down into spans to help you identify latency points and problematic services or calls, which you can use to troubleshoot application-level performance bottlenecks. And, because Datadog offers infrastructure monitoring in addition to APM, you get full-stack observability without the need to switch monitoring tools. This interoperability means you can easily create monitors on services and resources, which will notify you when a web endpoint experiences increased response time. You can then jump in and correlate a slow request with system metrics to see if, for example, an overloaded database server might be the cause. The Host Info panel shortens this gap even further.
It’s all about context
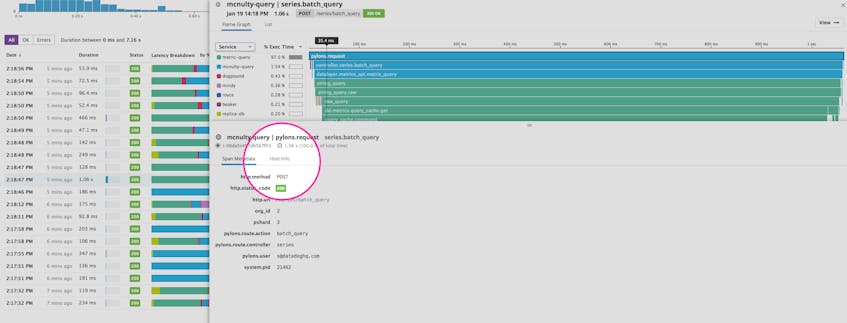
When viewing a span from a trace, Datadog APM already displays service-level metadata associated with that span, such as database query strings or HTTP URL parameters. Now, the new Host Info panel also automatically shows system metrics for the host responsible for the selected span, scoped to the span’s time period. The timeseries graphs also give you host-level context before and after the transaction to help determine whether a slow request was an outlier or part of a system-wide problem.
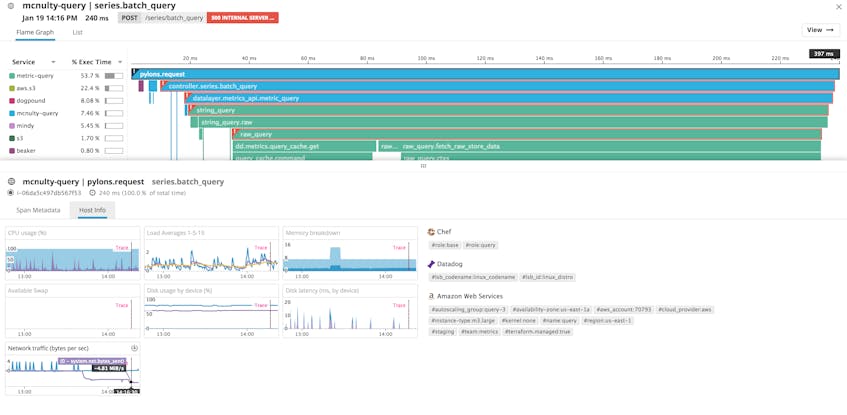
The Host Info tab also shows a full list of tags attached to the host for the selected span. Tags surface additional context by telling you what applications and services a host is running. They also provide information on the host itself and any active integrations. Host-level information might include things like availability zone, EC2 instance type, host role, and much more.
Speed up your application troubleshooting
Showing host data inline with your request traces gives you increased visibility into your full system, reducing time spent searching for the root cause of an issue. You can see, for instance, if a request that returned an HTTP status code of 500 ERROR may be the result of an undersized AWS instance that is out of memory. Or you can check if an HTTP server has reached its limit of open file descriptors and cannot accept new client connections.
Datadog APM’s new Host Info panel is another step toward unifying your workflow to help you better understand the behavior of your system and guide your root cause analysis when you encounter performance problems.
Try the Host Info panel today
If you’re already a Datadog customer, you can access the Host Info panel from Datadog APM. If not, try it out now by signing up for a free 14-day trial.
