To celebrate Batman’s 75th Anniversary and provide all of you with a little fun on Batman Day, we decided to graph the Batman Curve in Datadog using a custom Agent check.
Now the simplest way for us to send this Bat-signal to Datadog would be to just transcribe the coordinates and submit them on a schedule. But no self-respecting citizen of Gotham would do that. Instead, we’re plotting an equation that looks like Batman.
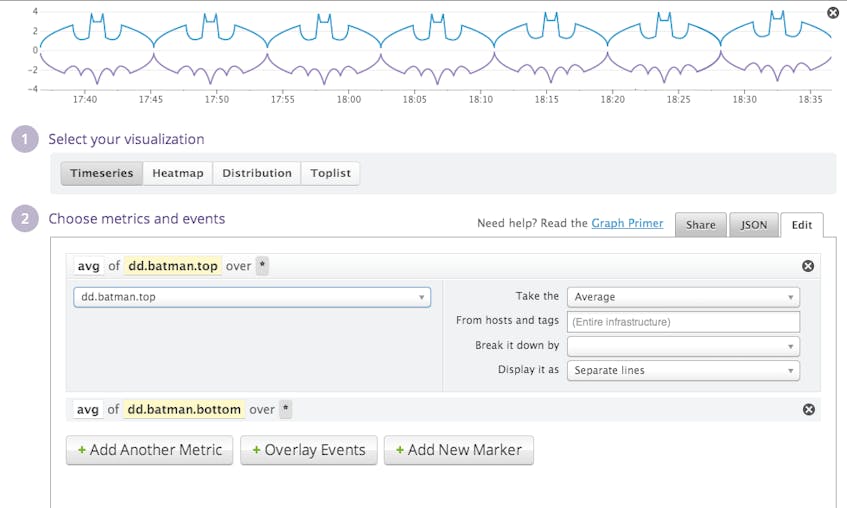
You, too, can shine the Bat-signal like Commissioner Gordon on your Datadog graphs with these step-by-step instructions. First, install the custom Agent check. When the check is in place and you are sending us Bat metrics, you can combine your metrics in one graph and make a signal. Select a timeseries visualization and plot the average of the dd.batman.top and dd.batman.bottom metrics like we have below:
To respond as fast as Batman does when your systems go down and create cool graphs like this, or better yet, graphs that provide actionable insight into the performance of your entire infrastructure, try Datadog free for 14 days.
Happy Batman Day!