

This is a guest post from Matthew Fornaciari, cofounder and CTO of Gremlin.
Reliable systems are vital to meeting customer expectations. Downtime not only hurts a company’s bottom line but can be detrimental to reputation. Our goal at Gremlin is to help enterprises build more reliable systems using Chaos Engineering. Whether your infrastructure is deployed on bare metal in a corporate-owned data center or as Kubernetes-orchestrated microservices in a public cloud, chaos experiments can help you find system weaknesses early, before they affect customers.
In this post, I want to share a few of the ways we use Datadog to monitor our own systems at Gremlin and talk about how we use the Gremlin integration with Datadog to monitor the real-time effects of our own chaos experiments.
Use template variables to build dynamic dashboards
As we were building the Gremlin platform, one of the first things we did was create a comprehensive dashboard that provided quick insight into key health metrics. To do this, we leveraged template variables, which allowed us to dynamically filter one or more widgets in a dashboard.
With template variables, we only need to create one comprehensive dashboard that contains the widgets we prefer. We can then use this dashboard to get visibility across all of our environments, apps, endpoints, and so on by leveraging template variables (like $Environment, $App, and $Path) to easily filter the dashboard for more specific insights (e.g., view metrics from all API paths ($Path:*), the production environment, and the control app).
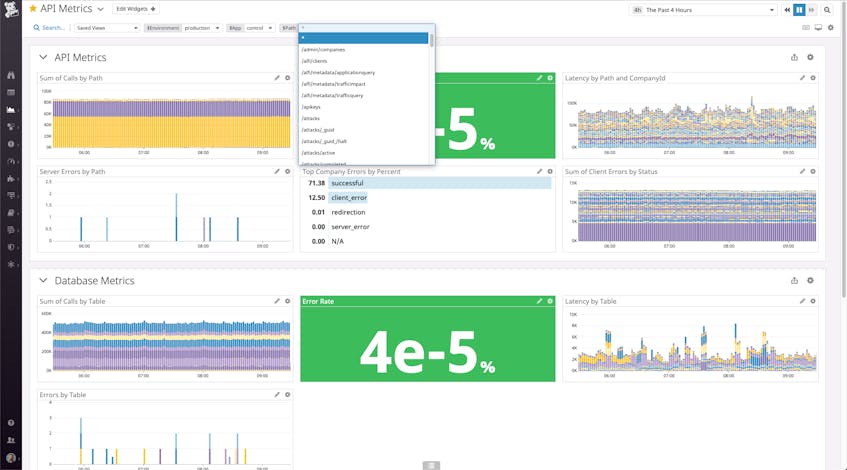
Template variables save us the trouble of having to reinvent the wheel when we want to monitor similar things across multiple places—and they make it an absolute breeze to monitor the process of spinning up a new service or endpoint.
Monitor key user flows with synthetic monitoring
We use Datadog Synthetic Monitoring to keep an eye on outgoing changes and how they affect key user flows. Synthetic monitoring provides immediate feedback if there happen to be any breaking changes, which is incredibly important—especially because troubleshooting these issues becomes increasingly difficult and time-consuming as our system grows and changes more rapidly.
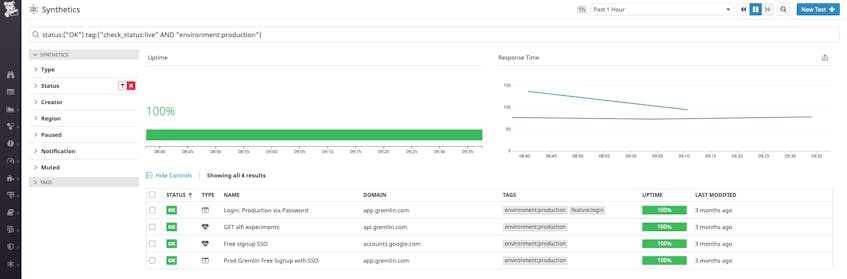
With just a few minutes of configuration we can set up browser tests to monitor key user flows and be confident that our users can perform important actions in our application. This insight is invaluable in complex systems; for example, it can help verify that your API is working as intended, even as changes are introduced into the system.
Chaos monitoring
Chaos Engineering is the science of proactively testing how a system responds under stress in order to identify and fix failures before they cascade into customer-facing issues or system downtime. Each chaos experiment involves:
- Intentionally provoking problems (known as attacks) in a controlled manner and with a limited blast radius
- Monitoring the system to see how it responds
- Using the collected insights to learn how to best mitigate the problem and prevent it from having a future customer impact
Because monitoring is a key aspect of learning from your chaos experiments, we partnered with Datadog to develop an integration that enables users to get more context around their attacks. At Gremlin, we love being able to publish events from our chaos experiments and then correlate them with other key datapoints in Datadog graphs. Annotating these graphs with interesting events, like an attack starting or stopping, enables us to understand how our chaos experiments play out in real time.
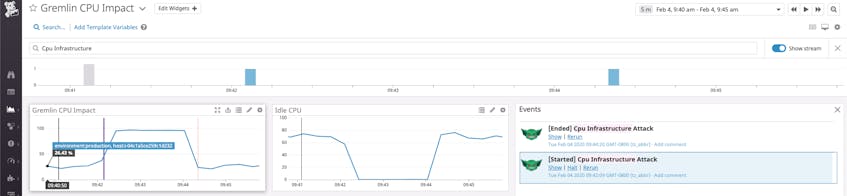
It’s an incredibly visceral feeling to kick off an attack and watch the effects—whether it’s CPU usage spiking through the roof, or a drop in all networking traffic, or status codes flipping from 200s to 500s. Then, we can click the HALT button to roll it back and watch everything flip back into the green, which helps provide a level of confidence in executing chaos experiments.
In addition to the HALT action mentioned earlier, Datadog’s Gremlin integration also includes support for rerunning an attack directly from the event stream. And we’re planning to add more functionality over time, such as the ability to roll back attacks directly from Datadog monitors. To learn more about how you can monitor your Gremlin chaos experiments with Datadog, check out the documentation.
